7.1 Formatting Technical Documents
Robin L. Potter
Technical documents are typically created using conventional formats that are recognized in professional contexts. For example, letters have a familiar look because of the standard components that are used to format such documents. These formats serve to signal the level of formality and the purpose of the documents. They also help to create a degree of standardization in the documentation that circulates within and outside of organizations. Formats also inform readers on how to read the documents. When you create a document in the workplace, it is expected that you will use formats and styles customarily used within the organization.
The chapter on Correspondence includes information on formatting email, memos, and letters. This chapter will focus on formatting various types of reports:
- Infographics
- Short reports
- Long reports
- Slide reports
More detailed information about these can be found in the Seneca Libraries’ technical communication library guide: Writing and Communicating Technical Information: Home. Below is an overview of basic formats for the documents.
Infographics
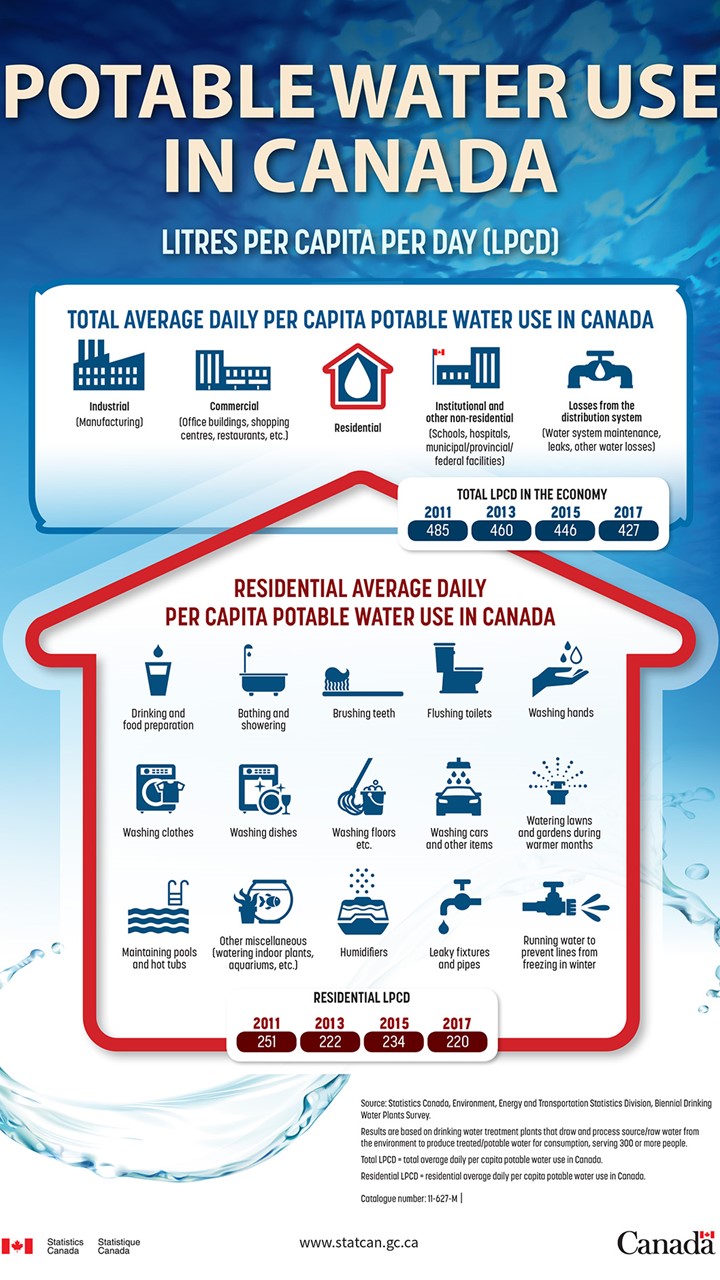
Infographics are reports that look like posters. They are created with digital templates or slide deck software to report information using visual narratives or stories. Infographics combine visual elements like icons, graphs, images, and/or charts, along with concise text, to promote an idea or to convey information in an engaging way. Software, such as PowerPoint, Adobe Spark, or Canva can be used to create infographics.
If you are seeking one specific type of format for infographics, you will be disappointed. Here, you can let your creative side flourish as you customize backgrounds, fonts, and formats to suit your subject and purpose. Some software, like Canva, offers free and premium ready-made templates that you can adapt to your own content. The key is to have done your research, mapped or sketched out your ideas, and planned the visuals you will be using to support them. Once you have done this, go into the software and design your document using a variety of background, font, and chart options.
When creating an infographic choose a template that aligns with your content. For example, if you are showing data related to geographic areas, choose a map template; if you are making a comparison, choose a two-column format.
Below are three examples of infographics. Note the sparse use of text, which offers only key information, and relevant images to highlight key ideas.
Pictorial infographic example: Potable Water Use in Canada (Statistics Canada, 2019).
Map infographic example: An Overview of Canada’s Forest Sector (Statistics Canada, 2018).
Text-based infographic example: What is radioactive waste? (Canadian Nuclear Safety Commission, 2017)
Seneca College offers many resources for learning about infographics. You might want to consider completing the Seneca Sandbox’s Creating Infographics tutorial or signing up for a webinar to learn more about how to create effective infographics.
(What Makes and Effective Infographic, 2018)
Knowledge Check
Report Formats
The previous sections of this text discuss the different types of technical reports and their typical usage and contents. Here we will discuss their various formats—that is, how they are prepared to conform to workplace conventions.
Informal Reports
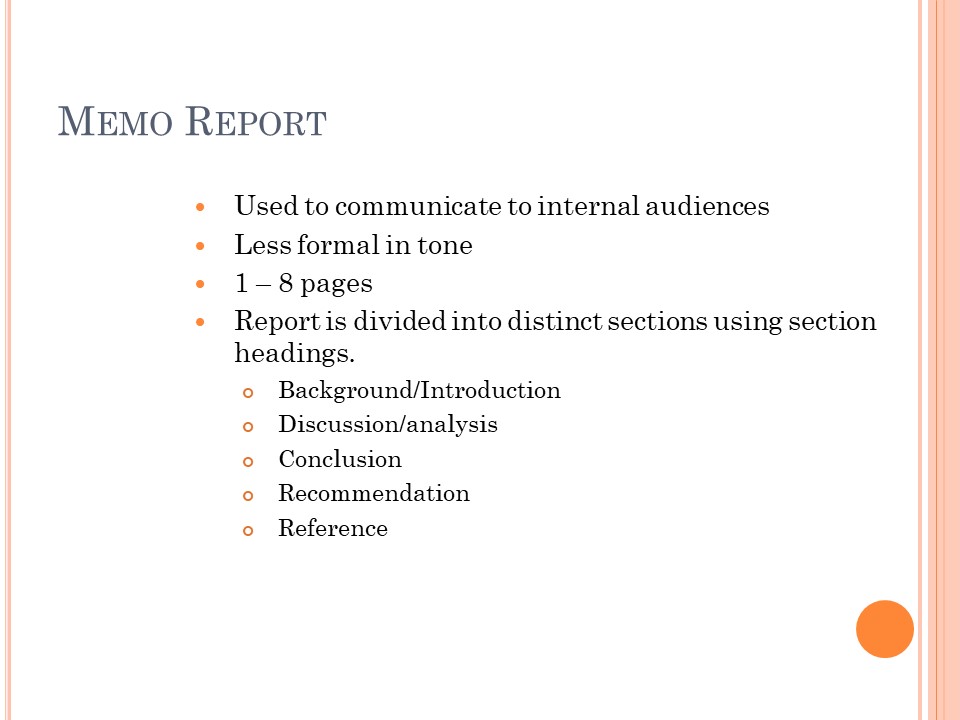
Informal reports, also known as short reports, are routine documents of two to five pages in length that focus on one specific topic–such as a recommendation, brief proposal, progress, or inspection. Such reports can be formatted either as memos or email reports for internal purposes. They can also be formatted as letter reports when conveyed outside the organization. An email report consists of a report that is composed inside the email message box. Both memo and letter reports are usually attached to transmittal email messages for rapid electronic delivery. See the chapter on Correspondence for information on how to format these documents.
You will find more detailed information about writing proposals, progress and recommendation reports in Chapter 8. Each of these reports can be written as short or long reports. You can view examples of several types of short reports, including conference, progress, summary, and recommendation reports, by visiting Venecia Williams’ Chapter 12: Report Writing Situations in The Fundamentals of Business Communication.
Formal Reports
Formal reports, also known as long reports, are documents that consist of about five or more pages in length. These reports not only offer a detailed discussion of research findings but are also used to make complex decisions within technical contexts. Examples of these reports include proposal, recommendation, problem-solving, feasibility, and compliance reports. Such documents can be circulated inside or outside an organization, with the transmittal document being formatted as a memo or letter to signal the document’s internal or external destination.
Since formal reports are lengthy documents, they are accompanied by additional components consisting of the front and back matter that serve to aid the reader in understanding the document and locating information. The components of a formal report are listed below. For information on how to create and paginate the front and back matter and how to format the contents to achieve optimum readability, please refer to A Guide to Writing Formal Technical Reports (Potter, 2021).
(Formal and Informal Reports, 2020)
Typical Components of Formal Reports
Front Matter
Cover page
Transmittal document (either a memo or a letter)
Abstract or summary
Table of contents
List of tables and figures
Glossary
Report
Introduction
Background, methodology
Findings, discussion
Conclusion (and recommendations)
Back Matter
References
Appendix
Slide Reports
(Why Slidedocs, 2022)
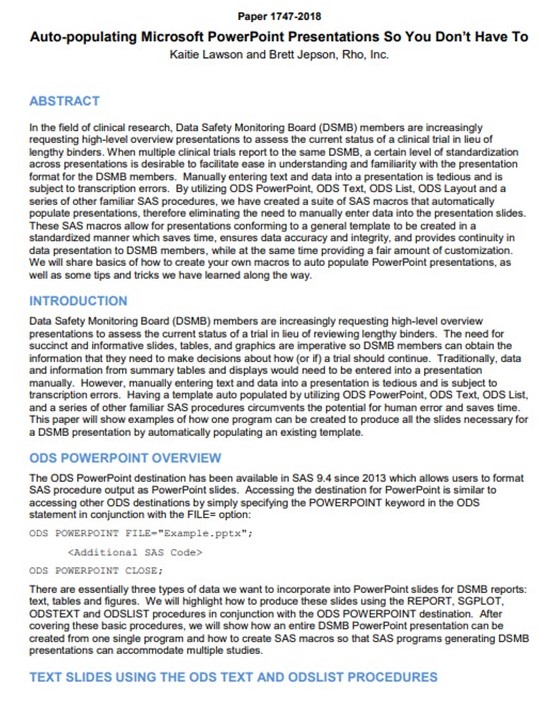
Slide reports are visual documents created using PowerPoint or other slide deck software and are a genre of slide documents (or slidedocs). Nancy Duarte, a leader in presentation skills education and author of Slidedocs (2016), coined the term after noticing how PowerPoint was being used to create documents other than presentation slide decks. In technology, slide reports have been used for the following purposes: definitions and descriptions, explanations, guides, instructions, tutorials, and report previews or summaries (Potter, 2020).
Slide reports are full reports meant to be read and not presented. As such, these documents include a title page, table of contents and list of tables and figures, a glossary (if needed), section or chapter guides, a list of references, and appendices (if required). While they offer full-text development of ideas, they bridge genres by resembling presentations in the ample use of visual content to amplify ideas, set context and atmosphere, and support and clarify ideas. These are typically visually engaging documents, with content developed in “bite-sized” segments for quick reading on the go. See the example of page design options in Figure 7.1.2.
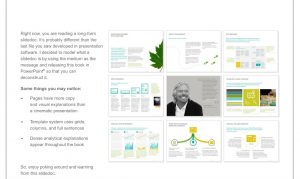
Figure 7.1.2 Page design examples suggested by Duarte (2016).
Characteristics of Technical Slide Report Design
- Headings, subheadings
- Enhanced appearance through the use of color and font styles
- Generous use of purposeful visual aids and visual information
- Full paragraph development using short paragraphs
- Information chunking into short sections
- One idea per slide (recommended)
- Parallel listing for items in a series
- Pull quotes to highlight key points
- Section guides for longer reports
- Section overviews set below headings
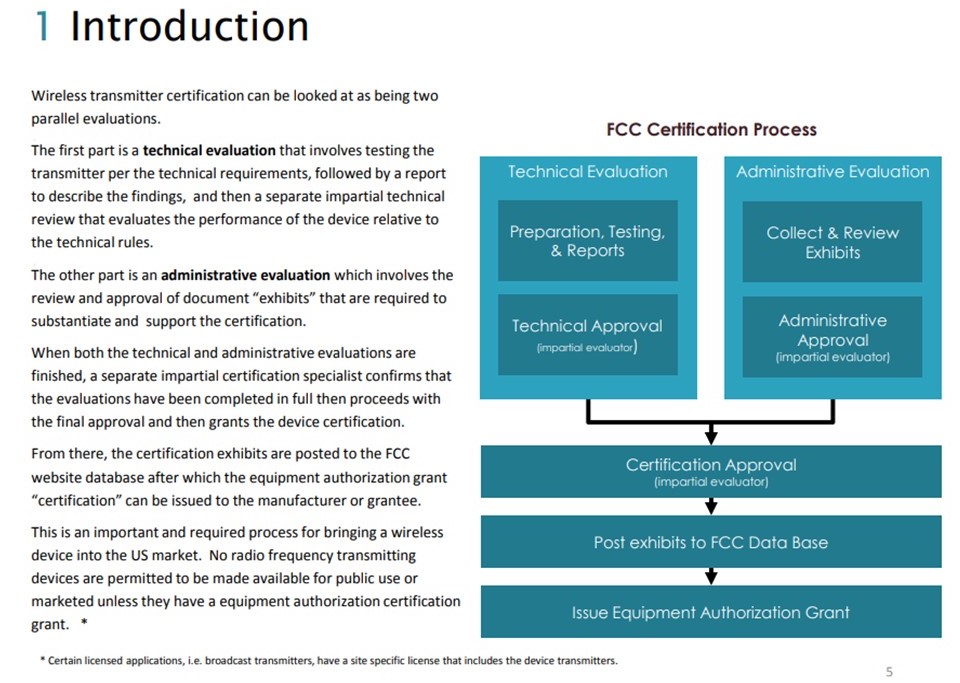
To view an example of a technical slide report, see Elite Electronics Inc.’s Guide to FCC Certification for Part 15C Wireless Transmitters.
Knowledge Check
 |
 |
 |
References
An overview of Canada’s forest sector. (2018, May 8). Statistics Canada. https://www150.statcan.gc.ca/n1/pub/11-627-m/11-627-m2018008-eng.htm
Canva. [Sample Infographic Templates]. (n.d.). https://www.canva.com/
Canadian Nuclear Safety Commission.(2017, December 8). What is radioactive waste? Government of Canada. https://www.cnsc-ccsn.gc.ca/eng/resources/infographics/waste/index.cfm
Duarte, N. (2016). Slidedocs. https://www.duarte.com/slidedocs/
Duarte, Inc. (2022). Why Slidedocs [Video]. Youtube. https://www.youtube.com/watch?v=cML-hxWOe5w
Easelly. (2008). What makes and effective infographic [Video]. Youtube. https://www.youtube.com/watch?v=rl9ZcfKt8sY
Elite Electronics Engineering, Inc. (2015, March). Guide to FCC certification for Part 15C wireless transmitters. http://www.elitetest.com/sites/default/files/downloads/guide_to_fcc_certification_for_part_15c_wireless_transmitters.pdf
McKinney, M. (2020). Formal and informal reports [Video]. Youtube. https://www.youtube.com/watch?v=1dIStGBff3A
Potable water use in Canada. (2019, June 11). Statistics Canada. https://www150.statcan.gc.ca/n1/pub/11-627-m/11-627-m2019022-eng.htm
Potter, R.L. (2020). Slide reports. Robin L. Potter: Artwork and Writing. robinlpotter.com/writing
Potter, R. L. (n.d., 2017, 2021). A guide to writing formal technical reports: Content, style, format. Original document by University of Victoria (n.d.). Engineering work term report guide: A guide to content, style and format requirements for University of Victoria engineering students writing co-op work term reports. (Updated by Suzan Last, October, 2017 and adapted by Robin L. Potter (2021). OER.
Seneca Libraries. (n.d.). Library & information technician: Create websites and infographics. Seneca College. https://library.senecacollege.ca/lit/websites_infographics
Seneca Libraries. (n.d.). Writing and Communicating Technical Information: Home. Seneca College. https://library.senecacollege.ca/technical
Seneca Sandbox. (n.d.). Creating infographics. Seneca College. https://sites.google.com/view/creating-infographics/creating-infographics
Statistics Canada. (2018, May 8). An Overview of Canada’s Forest Sector. Infographic. https://www150.statcan.gc.ca/n1/pub/11-627-m/11-627-m2018008-eng.htm
Statistics Canada. (2019). Potable Water Use in Canada Infographic. https://www150.statcan.gc.ca/n1/pub/11-627-m/11-627-m2019022-eng.htm
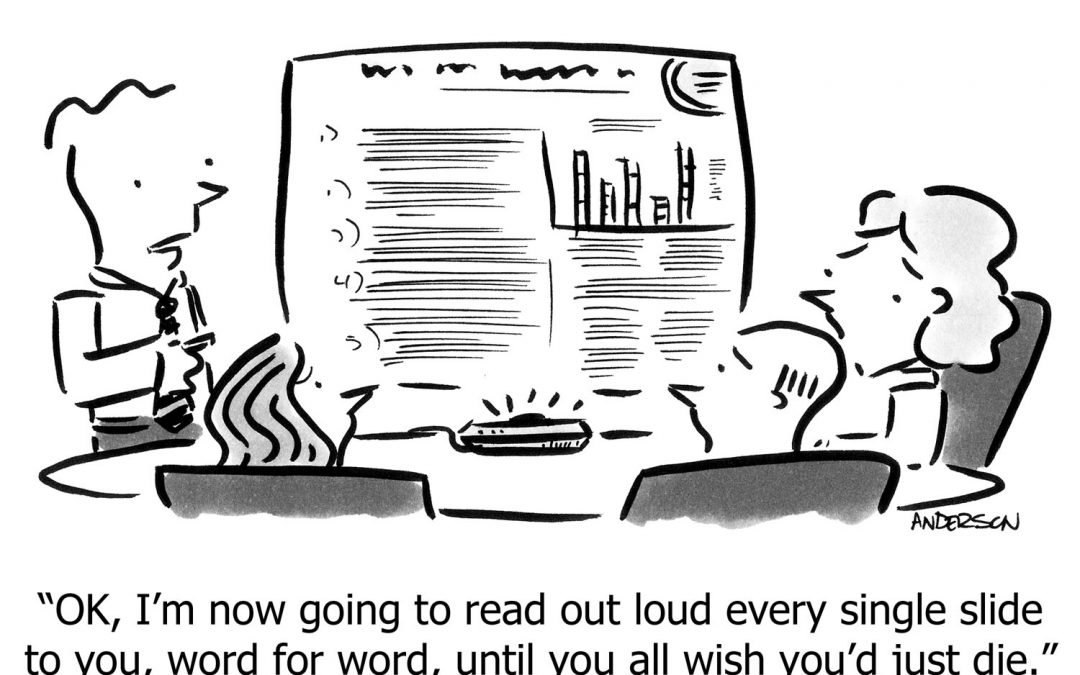
Triggs, M. (2017). Powerpoint is ruining your presentation. The Presentation Maestro.
