8.1 Organizing and Formatting Business Reports
Before we begin to investigate the different types and aspect of developing a business report, let’s take a quick overview of the business report.
Organization
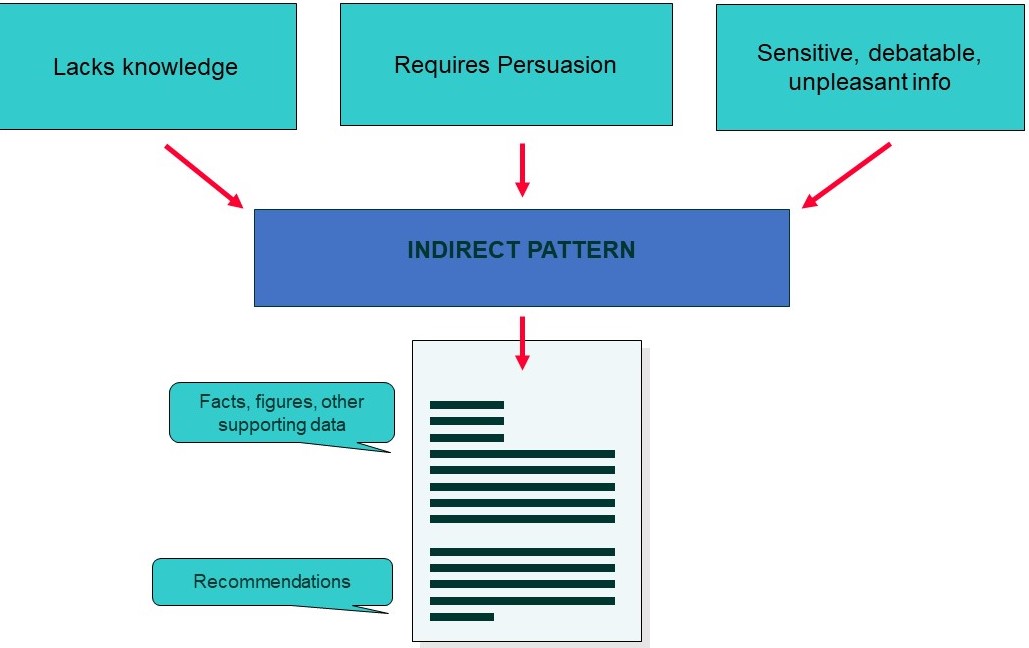
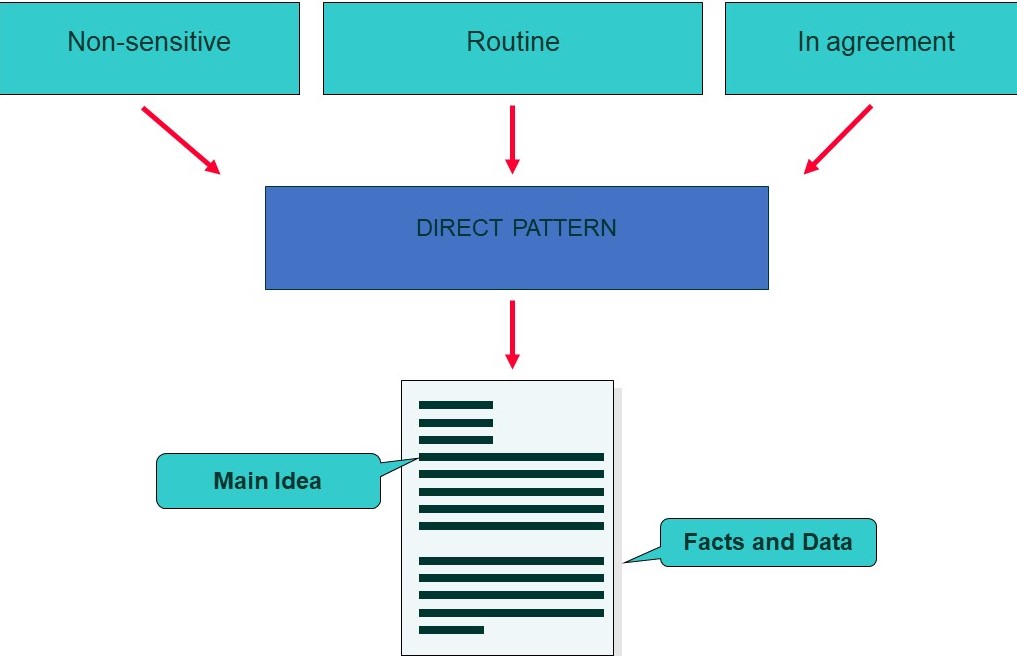
Much like correspondence, you may choose between the direct and indirect methods to structure your reports. The direct method is used when you have a receptive audience; whereas, the indirect method is used when you must persuade your audience. Whichever you decide to use will depend on the context, audience, and your purpose. Pay attention to these essential considerations when thinking of your stakeholders. Stakeholders may include the person(s) the report is about, whom it is for, who has an interest in the matter, and the organization overall. Ask yourself who the key decision makers are, who the experts will be, and how your words and images may be interpreted.
 |
 |
Reports vary by size, format, and function. You need to be flexible and adjust your report to the needs of the audience and to your purpose as there are several types of reports, including, for example, proposals, recommendations, problem-solving, and progress. Reports are typically organized around six key elements:
- Who the report is about and/or prepared for
- What was done, what problems were addressed, and the results, including conclusions and/or recommendations
- Where the subject is situated
- When the situation occurred
- Why the report was written (function), including under what authority, for what reason, or by whose request
- How the subject operated, functioned, or was used
When you write, your goal is not only to complete an assignment but also to write for a specific purpose—perhaps to inform, to explain, to persuade, or a combination of these purposes. Your purpose for writing should always be in the back of your mind, because it will help you decide which pieces of information belong together and how you will order them. In other words, choose the order that will most effectively fit your purpose and support your main point.
Table 8.1.1: Order and Purpose shows the connection between order and purpose.
| Order | Purpose |
|---|---|
| Chronological Order |
|
| Spatial Order |
|
| Order of Importance |
|
While there is no universal way for a report to be developed, conventions relating to the organization of the detail has evolved over time and is recognized in all business contexts, whether you are creating a direct or indirect document. See Table 8.1.2 for an overview of three basic document structures. The functions of each section of the document is described below in Table 8.1.3.
Table 8.1.2 Basic Report Structures
| Direct Method | Direct Method 2 | Indirect Method |
| Introduction with purpose statement
Background Details Conclusion/Recommendations References |
Introduction with purpose statement and background
Conclusion/Recommendations Details References |
General introduction suggesting the subject or problem
Background Details Purpose statement/main message Conclusion/Recommendations References |
Knowledge Check
The Outline
When you write, you need to organize your ideas in an order that makes sense. Order refers to your choice of what to present first, second, third, and so on in your writing. The order you pick closely relates to your purpose for writing that particular assignment. You may want to group your supporting ideas effectively to convince readers that your point of view on an issue is well reasoned and worthy of belief. In longer reports, you may organize different sections in different ways so that your purpose stands out clearly and all parts of the report work together to consistently develop your main point
Before writing any report, it is important to map out your ideas in an outline. An outline is a written plan that serves as a skeleton for the paragraphs and document sections you write. Later, when you draft paragraphs in the next stage of the writing process, you will add support to create “flesh” and “muscle” for your report. The outline is an essential tool in discovering the overall progression of ideas and planning your research and visual aids. The video, Creating an Outline (2014) describes the outline making process.
When creating outlines, writers generally go through three stages: a scratch outline, an informal or topic outline, and a formal topic or sentence outline:
- Scratch outline: The scratch outline is generated by taking information from your free-writing process and organizing it into a structure that is easy for you to understand and follow
- Informal outline: An informal outline goes a step further and adds topic sentences, a purpose statement, and some preliminary information you have found through research.
- Formal outline: A formal outline is a detailed guide that shows how all your supporting ideas relate to each other. It helps you distinguish between ideas that are of equal importance and ones that are of lesser importance.
There are two types of formal outlines: the topic outline and the sentence outline. You format both types of formal outlines in the same way.
- Place your introduction and purpose statement at the beginning, under Roman numeral I.
- Use Roman numerals (II, III, IV, V, etc.) to identify main points that develop the purpose statement.
- Use capital letters (A, B, C, D, etc.) to divide your main points into parts.
- Use Arabic numerals (1, 2, 3, 4, 5, etc.) if you need to subdivide any As, Bs, or Cs into smaller parts.
- End with the final Roman numeral expressing your idea for your conclusion.
Here is what the skeleton of a traditional formal outline looks like. The indention helps clarify how the ideas are related.
Introduction → Purpose statement
Main point 1 → becomes the topic sentence of body paragraph 1
-
- Supporting detail →becomes a support sentence of section 1
- Subpoint
- Subpoint
- Supporting detail
- Subpoint
- Subpoint
- Supporting detail
- Subpoint
- Subpoint
- Supporting detail →becomes a support sentence of section 1
Main point 2 → becomes the topic sentence of section 2 [same use of subpoints as with Main point 1]
-
- Supporting detail
- Supporting detail
- Supporting detail
Main point 3 → becomes the topic sentence of section 3[same use of subpoints as with Main points 1 & 2]
-
- Supporting detail
- Supporting detail
- Supporting detail
Conclusion
References
Constructing Informal or Topic Outlines
An informal topic outline is the same as a sentence outline except you use words or phrases instead of complete sentences. Words and phrases keep the outline short and easier to comprehend. All the headings, however, must be written in parallel structure.
Step 1: Create a purpose statement for your report
To plan your business report, you will begin by writing a draft purpose statement. A purpose statement is a concise presentation of the key idea you will develop in your report. It is the focal point for the development of ideas in your report. Write the purpose statement at the top of your outline. You can revise this later as your research and writing evolves.
The rest of your outline will include the main topics and sub-points you will develop in each paragraph or section of the report.
Step 2: Identify the main ideas that relate to your purpose statement
Based on the reading and research you have already done, list the main topics that you plan to discuss in your report. Consider carefully the most logical order, and how each point supports your purpose statement. These topics will become main ideas that will be developed.
Step 3: Identify the supporting points and evidence for each topic
Each topic will be supported by supporting points and evidence that you have compiled from other sources. Each piece of information from another source must be cited, whether you have quoted directly, paraphrased, or summarized the information.
Step 4: Create your outline
Outlines are usually created using a structure that clearly indicates topics and supporting points. In the example below, main ideas are numbered, while the supporting ideas are indented one level and labelled with letters. Each level of supporting detail is indented further.
Here is the informal topic outline that Mariah constructed for the report she is developing and that has been partially adapted for this text. Her purpose is to inform, and her audience is a general audience of her fellow college students. Notice how Mariah begins with her purpose statement. She then arranges her main points and supporting details in outline form using short phrases in parallel grammatical structure.
- Introduction
- Purpose statement: This report offers an overview of the available choices in digital technologies along with their specifications.
- E-book readers
- Books easy to access and carry around
- Electronic downloads
- Storage in memory for hundreds of books
- An expanding market
- E-book readers from booksellers
- E-book readers from electronics and computer companies
- Limitations of current e-book readers
- Incompatible features from one brand to the next
- Borrowing and sharing e-books
- Books easy to access and carry around
- Digital cameras taking over from film cameras
- Three types of digital cameras
- Compact digital cameras
- Single lens reflex cameras, or SLRs
- Cameras that combine the best features of both
- The confusing “megapixel wars”
- The zoom lens battle
- Three types of digital cameras
- Flat screen televisions
- 1080p vs. 768p
- Plasma screens vs. LCDs
- Home media centres
- Conclusion
- How to choose wisely
- References
Outlines at Work
Word processing programs generally have an automatic numbering feature that can be used to prepare outlines. This feature automatically sets indents and lets you use the tab key to arrange information just as you would in an outline. Although in business this style might be acceptable, in college or university your instructor might have different requirements. Teach yourself how to customize the levels of outline numbering in your word processing program to fit your writing context.
Knowledge Check
Formats
Business documents are typically created using conventional formats that are recognized in professional contexts. For example, letters have a familiar look because of the standard components that are used to format such documents. These formats serve to signal the level of formality and the purpose of the documents. They also help to create a degree of standardization in the documentation that circulates within and outside of organizations. Formats also inform readers on how to read the documents. When you create a document in the workplace, it is expected that you will use formats and styles customarily used within the organization.
The chapter entitled Correspondence Formats includes information on netiquette, texting, and the formatting of email, memos, and letters. The next section of this text discuss the different types of business reports and their typical usage and contents. In this chapter, we will discuss their various formats—that is, how they are prepared to conform to workplace conventions. Included in our overview are:
- Short reports
- Long reports
- Slide reports
- Infographics
Short Reports
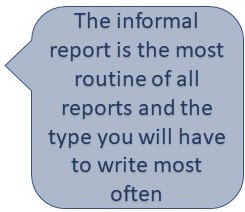
Informal reports, also known as short reports, are routine documents of two to 10 pages or so in length that focus on one specific topic–such as a recommendation, brief proposal, or progress. Such reports can be formatted either as memos or email reports for internal purposes. They can also be formatted as letter reports when conveyed outside the organization. An email report consists of a report that is composed inside the email message box. Both memo and letter reports are usually attached to transmittal email messages for rapid electronic delivery. The video, Guidelines for Writing Short Business Reports (2019), will help with the strategies of writing short reports.
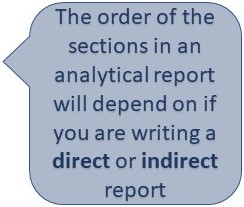
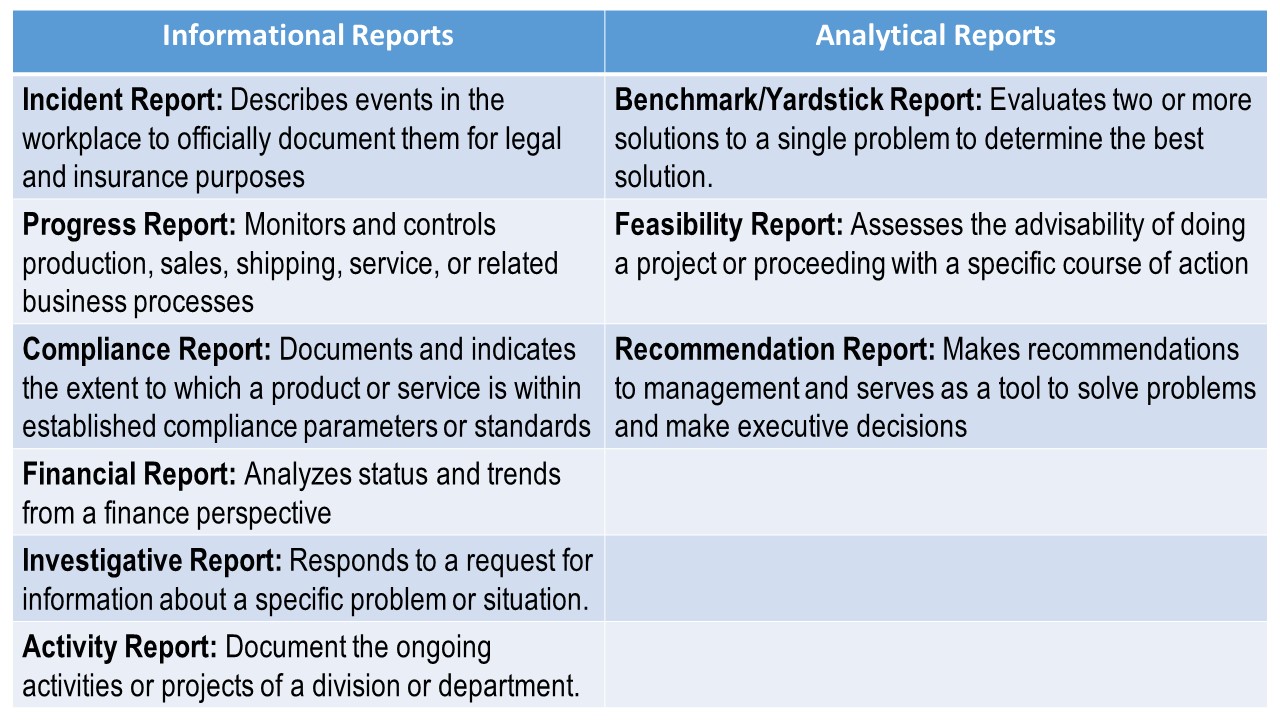
In addition, the informal report can be informational or analytical in nature. The informational report contains non-sensitive, routine information, often presented in a prescribed format such as a fill-in-the-blank form. For this reason, the sections of an informational report include the introduction, findings, and conclusion. In contrast, the short analytical report seeks to answer questions about specific problems with the aim of solving those problems. How can we use social media more effectively? Should we close or open a new plant? How can customer service be improved? Therefore, the short analytical report not only includes an introduction, findings, and conclusion, but also recommendations.
Table 8.1.3 Informational and Analytical Short Report Sections
Short Informational Reports
|
Short Analytical Reports
|
Informal Report Types and Functions
The video above provides a general overview of the short report. In your professional life, you will find that there are many different types of short reports to respond to the many different activities, duties, and responsibilities in business organizations. Table 8.1.4 below provides an overview of numerous types of short reports and their functions.
Table 8.1.4 Types and Function of Informal Reports (Smith, n.d.)
You will find more detailed information about writing proposals, progress and recommendation reports in the next chapters. Each of these reports can be written as short or long reports. You can view examples of several types of short reports, including conference, progress, summary, and recommendation reports, by visiting Venecia Williams’ Chapter 12: Report Writing Situations in The Fundamentals of Business Communication.
Knowledge Check
Formal Reports
Formal reports, also known as long reports, are documents that consist of about five or more pages in length. These reports not only offer a detailed discussion of research findings but are also used to make complex decisions within business contexts. Examples of these reports include audit, proposal, recommendation, problem-solving, feasibility, and compliance reports. Such documents can be circulated inside or outside an organization, with the transmittal document being formatted as a memo or letter to signal the document’s internal or external destination. The following video, Writing Long Reports (2019), provides and comprehensive overview of the long report.
Since formal reports are lengthy documents, they are accompanied by additional components consisting of the front and back matter that serve to aid the reader in understanding the document and locating information. The components of a formal report are listed below in Table 8.1.4. You will notice that the report format consists of three sections: the front matter, with the cover page, table of contents, and executive summary; the report, with the introduction, background, details, and conclusion/recommendations; and the back matter, consisting of the references and the appendix/appendices.
For information on how to create and paginate the front and back matter and how to format the contents to achieve optimum readability, please refer to A Guide to Writing Formal Business Reports (Potter, 2021).
Table 8.1.4 Components of a Formal Report (partially adapted from Cruthers, 2020)
Element |
Description |
|
Front Matter Title page |
Report title; date of submission; name, title, and organization of the person who prepared the report; name, title, and organization of the person receiving the report. If your report contains sensitive information, the cover page should indicate the level of confidentiality. In addition, if it is going to be exposed to the elements, it might also contain a cover. No page number. |
|
Table of contents List of tables and figures |
A list of the sections in the report and their respective page numbers.
Below, add a list of tables and figures, consisting of the number, caption, and page number. This page is not labelled with a page number. |
|
Executive summary |
The executive summary is a one-page overview of the entire report. It discusses the managerial implications of your report: basically what managers or other people who have authority need to know. Summarize the topic, methods, data/evidence, results, and conclusions/recommendations. Place on its own page. Label as page iii; note the use of Roman numerals for all front matter except for the title page. |
|
Report Introduction |
Introduces the topic of the report, states the purpose of the report, and previews the structure of the report. This section often contains similar information to the Executive Summary, but in a clear, factual manner. Begins on a new page. Labelled as page 1. |
|
Background
|
Discusses the circumstances or context relating to the subject matter of the report. Explain the research rationale and methods. |
|
Details/findings |
Key elements of the report body may include the findings, results, and analysis or discussion. Includes research evidence. Uses descriptive or functional headings and sub-headings. Pagination continues from the introduction. |
|
Conclusion and/or recommendations |
Concise conclusion based on findings. May or may not include recommendations, depending on the context and report purpose. Pagination continues from the body of the report. |
|
Back Matter References |
A list of all references used in the report. All in-text citations included in the report should have an accompanying entry in the reference list. Begins on a new page. Pagination continues from the conclusions and/or recommendations. |
|
Appendix or appendices |
Related supporting materials. All materials in the appendix (or appendices) must be referred to in the body of the report. Only one item per appendix. Each appendix begins on a new page, is labelled as Appendix A, B, C, etc., and is given a title. Pagination continues from the reference list. |
Knowledge check
Slide Reports
Slide reports are visual documents created using PowerPoint or other slide deck software and are a genre of slide documents (or slidedocs). Nancy Duarte, a leader in presentation skills education and author of Slidedocs (2016), coined the term after noticing how PowerPoint was being used to create documents other than presentation slide decks. In business, slide documents have been used for the following types of documents: annual reports, guides, instructions, tutorials, and report previews or summaries (Potter, 2020). In the video below, Nancy Duarte provides some tips on designing slide decks.
Slide reports are full reports meant to be read and not presented. As such, these documents include a title page, table of contents and list of tables and figures, a glossary (if needed), section or chapter guides, a list of references, and appendices (if required). While they offer full-text development of ideas, they bridge genres by resembling presentations in the ample use of visual content to amplify ideas, set context and atmosphere, and support and clarify ideas. These are typically visually engaging documents, with content developed in “bite-sized” segments for quick reading on the go. See the example in Figure 8.1.1., which illustrates various page design options as suggested by Duarte (2016).
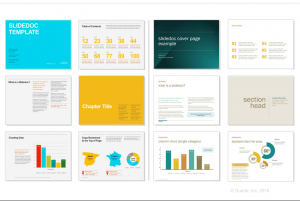
Figure 8.1.1 Page design samples for slide reports (Duarte, 2016).
Characteristics of Slide Report Design
- Headings, subheadings
- Enhanced appearance through the use of color and font styles
- Generous use of purposeful visual aids and visual information
- Full paragraph development using short paragraphs
- Information chunking into short sections
- One idea per slide (recommended)
- Parallel listing for items in a series
- Pull quotes to highlight key points
- Section guides for longer reports
- Section overviews set below headings
See Figure 8.1.2 for an example of a slide report page. Unlike a slide presentation, this sample page contains a considerable amount of text–which indicates that the report is not meant for presenting, but for reading. Notice how a large amount of text has been rendered readable through the use of a column format using short paragraphs. Notice also how a meaningful chart is integrated using colour that aligns with the slide design element. In addition, note how the page guide is included at the bottom of the slide; it helps the reader become quickly oriented as to the topic under discussion.
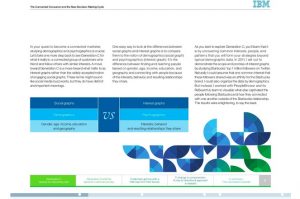
Figure 8.1.2 Sample page from a slide report by Brian Solis (2015).
To view another example of a slide report created for an annual report, see the Payments Canada 2020 Annual Report (Payments Canada, 2021).
Knowledge Check
Infographics
Infographics are reports that look like posters. They are created with digital templates or slide deck software to report information using visual narratives or stories. Infographics combine visual elements like icons, graphs, images, and/or charts, along with concise text, to promote an idea or to convey information in an engaging way. Software, such as PowerPoint, Adobe Spark, or Canva can be used to create infographics.
If you are seeking one specific type of format for infographics, you will be disappointed. Here, you can let your creative side flourish as you customize backgrounds, fonts, and formats to suit your subject and purpose. Some software, like Canva, offers free and premium ready-made templates that you can adapt to your own content. The key is to have done your research, mapped or sketched out your ideas, and planned the visuals you will be using to support them. Once you have done this, go into the software and design your document using a variety of background, font, and chart options.
When creating an infographic choose a template that aligns with your content. For example, if you are showing data related to geographic areas, choose a map template; if you are making a comparison, choose a two-column format.
Below are links to three examples of infographics. Note the sparse use of text, which offers only key information, and relevant images to highlight key ideas.
Infographic example with data and map: Direct Marketing in Canada: Agriculture (Statistics Canada 2017).
Map infographic example: An Overview of Canada’s Forest Sector (Statistics Canada, 2018).
Text-based infographic example: From Email To Bots: The Future of Customer Communication (D’Adamo, 2017).
Seneca College offers many resources for learning about infographics. You might want to consider completing the Seneca Sandbox’s Creating Infographics tutorial or signing up for a webinar to learn more about how to create effective infographics.
A Checklist for Effective Reports
Here is a checklist for ensuring that a report fulfills its goals:
- Report considers the audience’s needs
- Form follows function of report
- Format reflects institutional norms and expectations
- Information is accurate, complete, and documented
- Information is easy to read
- Terms are clearly defined
- Figures, tables, and art support written content and so are purposeful
- Figures, tables, and art are clear and correctly labelled
- Figures, tables, and art are easily understood without text support
- Words are easy to read (font, arrangement, organization)
- Results are clear and concise
- Recommendations are reasonable and well-supported
- Report represents your best effort
- Report speaks for itself without your clarification or explanation
References
Bovee, C., Thill, J., & Scribner, J. (2016). Business communication essentials (4th ed.). Toronto, ON: Pearson Canada Inc. Retrieved from http://www.pearsoncanada.ca/highered/product-showcase/new-solutions-for-core-foundations-from-pearson-canada/business-communication-essentials-fourth-canadian-edition-4e
Canva. [Sample Infographic Templates]. (n.d.). https://www.canva.com/
Cruthers, A. (2020). Organizing reports. Business writing for everyone. https://kpu.pressbooks.pub/businesswriting/chapter/organizing-reports/
D’Adamo. A. (2017, October 11). Infographic: From email to bots: the future of customer communication. Stella Rising. https://www.stellarising.com/blog/infographic-from-email-to-bots-digital-marketing-trends-in-2017-wmi
Duarte, N. (2016). Slidedocs. https://www.duarte.com/slidedocs/
GreggLearning. (2019). Guidelines to writing short business reports [Video]. Youtube. Retrieved from https://www.youtube.com/watch?v=TW-1aan4nFs
Guffey, M., Loewry, D., Rhodes, K., Rogin, P. (2016). Business communication: Process and product (5th ed.). Toronto, ON: Nelson Education. Retrieved from http://www.cengage.com/cgi-wadsworth/course_products_wp.pl?fid=M20b&product_isbn_issn=9780176531393&template=NELSON
Horkof, T. (2021). Outlining. Writing for success: 1st H5P Edition. CC 4.0. OER. BCcampus. https://opentextbc.ca/writingforsuccessh5p/chapter/outlining/
Kwantlen Polytechnic University Learning Centres. (2018). Creating an Outline. University 101. https://pressbooks.bccampus.ca/studystrategizesucceed/chapter/create-an-outline/
Lumen (n.d.). Informal reports. Business communications skills for managers. Retrieved January 12, 2020 from https://courses.lumenlearning.com/wmopen-businesscommunicationmgrs/chapter/informal-reports/
Meyer, C. (2017). Communicating for results (4th ed.). Don Mills, ON: Oxford University Press. Retrieved from https://oup-arc.com/access/meyer-4e-student-resources#tag_case-studies
Potable water use in Canada. (2019, June 11). Statistics Canada. https://www150.statcan.gc.ca/n1/pub/11-627-m/11-627-m2019022-eng.htm
Payments Canada. (2021). 2020 Annual report. Annual reports. https://www.payments.ca/about-us/annual-reports
Potter, R.L. (2020). Slide reports. Robin L. Potter: Artwork and Writing. robinlpotter.com/writing
Potter, R. L. (n.d., 2017, 2021). A guide to writing formal business reports: Content, style, format. Original document by University of Victoria (n.d.). Engineering work term report guide: A guide to content, style and format requirements for University of Victoria engineering students writing co-op work term reports. (Updated by Suzan Last, October, 2017 and adapted by Robin L. Potter (2021). OER.
Seneca Libraries. (n.d.). Library & information technician: Create websites and infographics. Seneca College. https://library.senecacollege.ca/lit/websites_infographics
Seneca Libraries. (n.d.). Writing and Communicating Technical Information: Home. Seneca College. https://library.senecacollege.ca/technical
Seneca Sandbox. (n.d.). Creating infographics. Seneca College. https://sites.google.com/view/creating-infographics/creating-infographics
Smith, J., Bartsiokas, T., & Hylton, T(n.d. ) Report Type and Function: Informal Report. Communication at work. https://kpu.pressbooks.pub/communicationsatwork/chapter/report-type-and-function-informal-report/
Solis, B. (2015, March 26). The connected consumer and the new decision-making cycle. SlideShare. https://www.slideshare.net/briansolis/the-connected-consumer-and-the-new-decisionmaking-cycle-46336230
Stanford Graduate School of Business. (2014). Nancy Duarte: How to create better visual presentations [Video file]. Retrieved from https://www.youtube.com/watch?v=so9EJoQJc-0
Statistics Canada. (2018, May 8). An Overview of Canada’s Forest Sector. Infographic. https://www150.statcan.gc.ca/n1/pub/11-627-m/11-627-m2018008-eng.htm
Statistics Canada. (2017). Direct Marketing in Canada: Agriculture. Infographic. https://www150.statcan.gc.ca/n1/pub/11-627-m/11-627-m2017015-eng.htm
Williams, V. (XX). Chapter 12: Report Writing Situations. In The Fundamentals of Business Writing. https://pressbooks.bccampus.ca/businesswritingessentials/chapter/chapter-14-routine-report-writing-situations/
