7. Monitoring and Controlling
7.1 What is Monitoring and Controlling?
Monitoring and controlling involves regularly measuring progress on a project to ensure it continues meeting objectives and addressing current organizational needs. It involves determining what corrective action is required, when it must occur, and who must do it. Monitoring should begin in the planning phase because it is easy to get off track with planning efforts. When the predictive/waterfall development methodology is used, the team is monitoring performance against the timeline, budget, scope, and quality objectives for the entire project. When an adaptive approach is used, progress within the iteration is assessed.
It is important to note that it is much easier to monitor project success on small projects. Due to far fewer team members, stakeholders, and complexities to consider, the project’s progress is more easily observed. However, on higher complexity projects that require many people, who are often spread out over different locations, project leaders are unable to use simple observation to assess progress. In these instances, it is important to have more robust tools and techniques that monitor the success of the full project team.
The project team evaluates its performance against the plans that have been developed. Every project requires a monitoring and control system. This system considers the following:
- What information is needed and how should it be collected?
- When (and with what frequency) should this information be collected?
- Who should collect and analyze this information?
- How should this information be represented from a reporting perspective?
- Who should prepare the report?
- Who should receive the reports?
Commonly collected information includes the status of the project budget and the project schedule. The work completed to date, what has yet to be completed, and the likelihood of completing the project on time and on budget are of particular interest. In addition, it is important to identify the risks and issues that require attention. Whenever possible, information technology should be used to collect and analyze the information, and distribute the reports. Different organizations require different roles to collect and analyze the project information. In organizations with a project management office (PMO), they may be accountable for progress reporting in an “end-to-end” way, meaning they would be involved from information collection all the way to report distribution. Organizational culture influences who and how progress monitoring is performed.
One of the common methods used to monitor progress is team meetings. Team meetings are highly collaborative and serve many purposes, including information sharing and team development. Depending on the nature of the project, these meetings may be focused exclusively on sharing the status of tasks underway. It is also possible for status discussions to lead to team planning. The individuals who participate in these meetings vary depending on many factors, such as development methodology in use, organizational culture, project complexity, and status of the overall project.
Project teams typically develop different reports for different stakeholders. Stakeholders who have a high interest and high power/influence will receive more information, more frequently (recall the stakeholder power/interest grid presented in Chapter 4). Depending on the priority and duration of the project, the reporting frequency could be daily, weekly, monthly, or quarterly.
There are three different types of project reports:
- Status reports – where the project stands at a specific point in time
- Progress reports – what the project team has accomplished during a certain period
- Forecasts – future project status based on current project status and known trends
A common and simple approach to sharing project status is the stoplight. Red means the project will not accomplish its objective(s). Yellow means the project may not accomplish the objective(s). Green means the project is on track to accomplish its objectives.
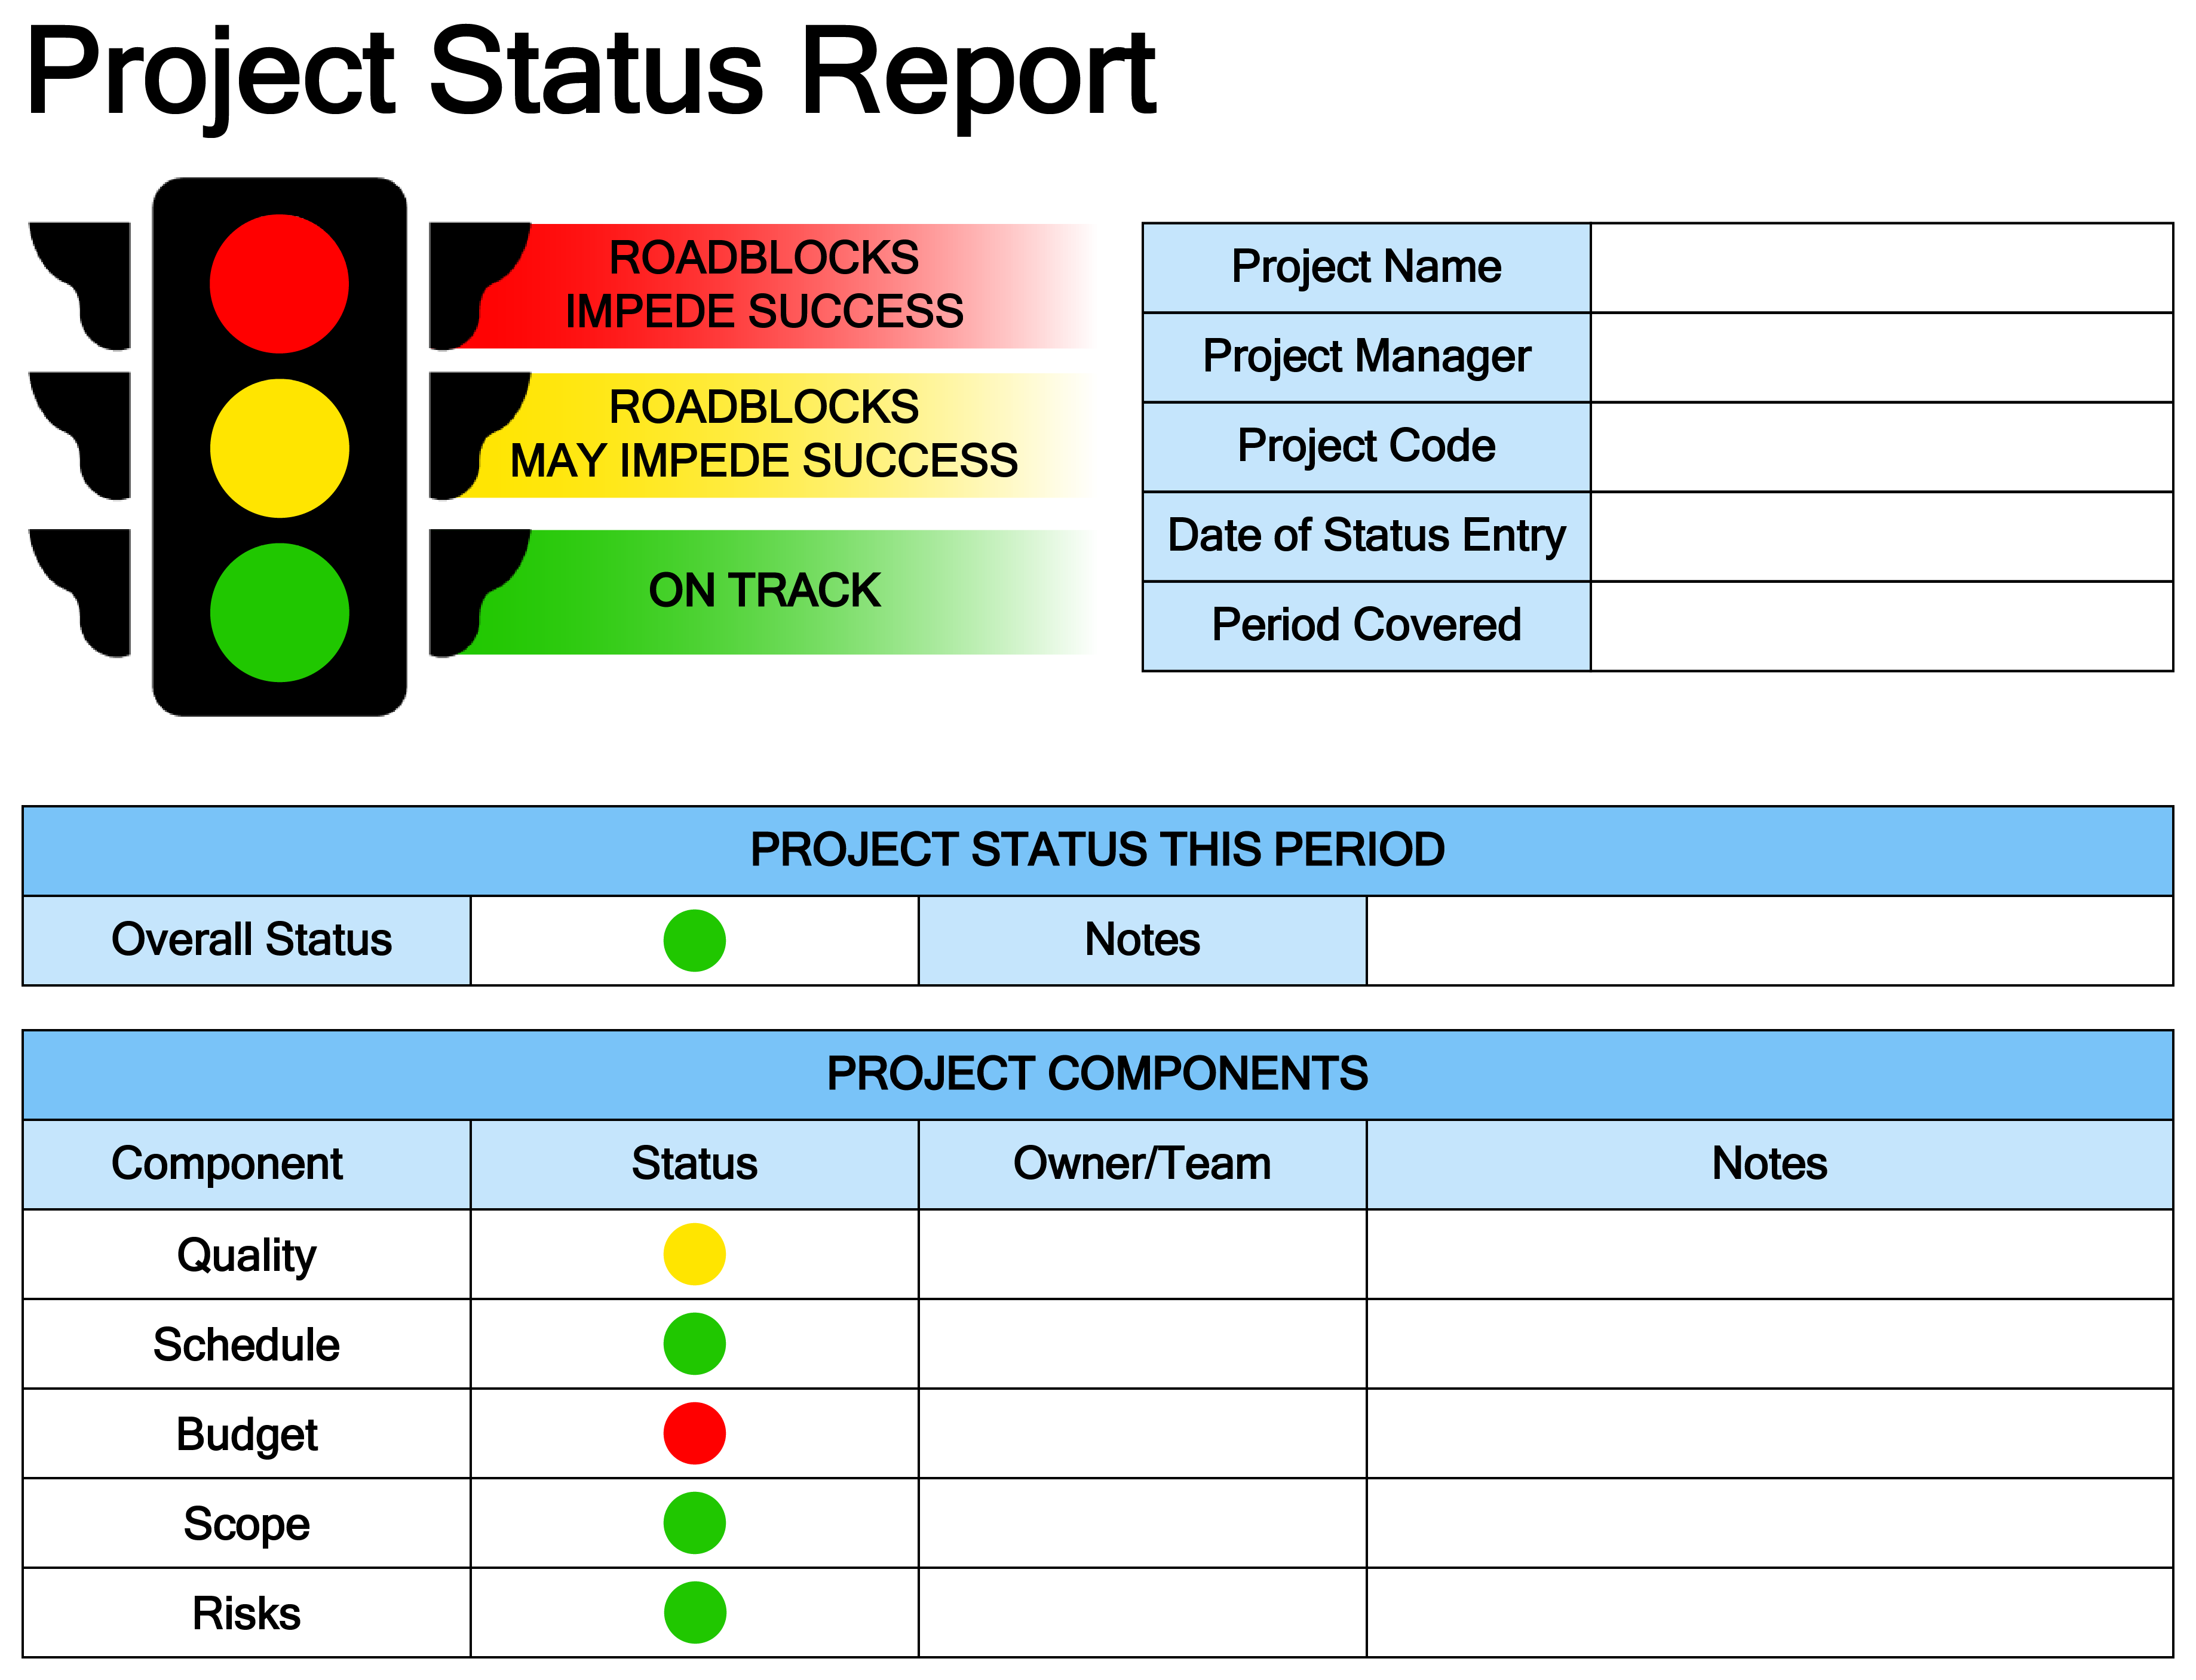
Exhibit 7.1: Example of a project status report utilizing stoplight symbology.
The status of a project is subject to change very quickly because unexpected risks can surface at any moment and new opportunities may be discovered.
Project leaders will develop a reporting format that meets the needs of the stakeholders and quite likely includes a combination of the above types.
Experienced project leaders know that project success is much more than delivering on time, on budget, and within the defined scope and quality parameters. This is not enough. A project that fulfills those parameters while failing to address the organizational need that led to its initiation would be considered unsuccessful. This is an extremely important concept to understand as it widens the lens of what project leaders monitor and how they respond to change. This leads to an important distinction – qualitative versus quantitative monitoring.
7.2 Qualitative and Quantitative Monitoring
Qualitative monitoring, as its name implies, involves measuring quality rather than quantity. Quantitative monitoring uses metrics and indexes to assess project performance.
In the context of project management, qualitative monitoring addresses the following questions:
- Is the team delivering on the intended scope in order to fulfill the project’s objectives and organizational needs?
- Is the quality of the deliverables meeting stakeholder expectations?
- Are stakeholders engaged?
- Are project communications effective?
- Are the expectations outlined in procurement contracts being adhered to by vendors?
- Are risks and opportunities being effectively managed by the team?
- Has the team become high-performing and are individual team members meeting performance expectations?
- Are resources being effectively managed and available as expected?
Project leaders use a variety of monitoring tools and techniques. The complexity of the project is a key consideration in determining the required tools and techniques.
Scope monitoring and control
The approach taken to monitor and control scope depends on the development methodology used. The predictive/waterfall approach involves a sequential definition of requirements and scope, which then leads to solution development. This approach is commonly utilized when the organization has a clear vision of the project’s end outcome. Given this, monitoring and controlling scope occurs with the premise that scope change is not expected. Validating scope involves formal acceptance of the completed project deliverables by the project sponsor and their assigned designates. Acceptance often requires deliverable reviews where the quality of the work is inspected before sign-off is provided. It is possible that changes will be required. These changes can be a result of poor quality (which leads to re-work) or new requirements intended to improve the organizational value of the project’s outcomes. New requirements are carefully controlled. This is necessary because once solution development begins, the project’s resources, timelines, and budget were all defined with a specific scope in mind. A scope change may mean those resources, timelines, and budgets are now insufficient to deliver on the increased scope. Controlling scope in this situation requires the project team to assess the impact of the new requirement on all the project’s constraints. If necessary, the team will seek approval for additional funding, time, and/or resources to pursue the new requirement. It is important for project leaders to reserve judgement on scope changes until the impact and benefits are clearly understood. The term “scope creep” refers to the poorly controlled expansion of scope over time. This means that the scope expands, perhaps unintentionally, without an understanding of its impact on the project’s other constraints, such as time and budget. Therefore, utilizing an integrated approach for change management is a critical success factor for projects using the predictive/waterfall approach.
Projects that follow an adaptive development methodology, such as agile, view scope change very differently. Scope definition, as well as solution development and testing, occur in an iterative or incremental fashion. As new requirements are identified, they are evaluated from a cost/complexity and benefit perspective, and if worth pursuing, they will be scheduled into a future iteration. A continuous improvement mindset encourages scope definition to occur in cycles.
Quality monitoring and control
Quality is about ensuring the expectations of the project sponsor have been met. This involves ensuring the expectations of the end-user community are well understood. High quality is achieved by planning for it (proactive) rather than by reacting to problems after they are identified (reactive).
Standards are chosen and processes are established to achieve those standards in the planning phase. Project quality focuses on the end deliverables that reflect the purpose of the project. The project leader is responsible for developing a quality management plan that defines the quality expectations and ensuring the specifications and expectations are met.
In the execution phase, the project team attempts to prevent quality issues from occurring with the use of quality management techniques, such as checklists, assessments, and lean six-sigma tools. Lean six-sigma tools are focused on creating efficient and effective processes that involve error-proofing methods.
In the monitoring and control phase, the project team is reviewing the project deliverables to ensure they are ready for review and sign-off. Ideally, this review leads to deliverable acceptance. However, the team may encounter problems that they are unable to prevent. When this occurs, the team’s objective is to determine how to fix these problems.
One of the most effective ways to address a problem is to begin by understanding its root cause(s). Cause-and-effect diagrams, also referred to as fishbone or Ishikawa diagrams, are very effective for this purpose. Section 5.8 provides an example of a cause and effect diagram.
Stakeholder management
Project teams can not control stakeholders. However, they can significantly influence their level of engagement. During the planning phase of a complex project, the stakeholder register may have been created. A stakeholder register is an effective tool for keeping track of a project’s stakeholders, their relative interest in the project, and their level of power/influence over the project’s outcomes. The register provides an effective starting place for determining how to engage stakeholders. The emphasis is on keeping high interest, high power/influence stakeholders very informed of the project’s progress.
During the monitoring and control phase, the project team is looking for new stakeholders and is monitoring the engagement level of existing stakeholders.
Engagement techniques will vary from one organization to another as their respective cultural norms and values influence how individuals work together. Some organizations prefer face-to-face interaction while others prefer the use of electronic messaging and project team websites. Whatever the methods are used to engage stakeholders, it is important to keep stakeholders informed of the project’s progress and to find the right approaches for meaningfully involving stakeholders throughout the life of the project.
A project leader’s interpersonal skills are critical in stakeholder management. Some stakeholders may have become unresponsive to the project team’s requests. When this occurs, the project leader’s relationship-building skills will put to the test as they attempt to understand the stakeholder’s actions. Conflict resolution skills, such as negotiating, are vital because stakeholders are very likely to have differing priorities, and successfully navigating these conflicts can be the difference between project success and project failure.
Communications management
Communication is one of the most effective ways to keep stakeholders engaged. In order for this communication to be effective, it must be developed and delivered in ways that consider stakeholder roles and communication preferences. During the planning phase, a communication plan would be created to guide the project team’s communication efforts throughout the project. It is important for project leaders to proactively determine if the selected communication methods will be suitable for the key stakeholders. This is done by directly asking them and monitoring their responsiveness to the communication delivered. Another important way to determine if project stakeholders are well-informed is to pay careful attention to the questions they ask. Questions about project progress that have been addressed in recent project communications are a good sign that the communication techniques may not be effective for a particular stakeholder. When this occurs, it is time to revisit the communication plan and make the appropriate adjustments.
Procurement management
Monitoring procurement includes ensuring the vendors’ performance meets the agreed-upon, often contractual, requirements. The complexity of the project determines the number and type of vendors procured. This, in turn, determines the nature of the monitored activities. For instance, projects that only require supplies to be purchased externally will have much simpler vendor management processes than projects that had to outsource the completion of some of the work to external consultants.
Key tools and techniques that may be used in procurement management include inspections, audits, formal change control methods, vendor-produced performance reports, payment systems, and contract administration.
Risk management
Monitoring and controlling risks involves implementing the risk management plan identifying during the planning phase. A key aspect of this plan is often the risk register, which helps the team keep track of the project risks, triggers (early warning signs), and risk responses. Risk responses can be implemented in any phase of the project as long as documentation is kept up to date.
Many project teams established contingency plans and contingency funds to account for risks that cannot be anticipated. When these unanticipated risks materialize, the project team will determine if the contingency plans and/or funds will address these risks and, if so, they will be implemented. If contingency plans/funds will not suffice, the project team must identify workarounds. Contingency plans and workarounds are then monitored to determine if they were effective. Additional corrective action may be required.
Resource management
Projects require labour and non-labour resources in order to produce the desired outcomes. During monitoring and controlling, the project leader is assessing the effectiveness of both types of resources.
With respect to the project team, efficient project leaders are continuously assessing the performance of the team and its members. Effective coaching and mentoring skills are essential and can be the difference between project success and failure. In addition, a project leader must sometimes make the difficult decision to replace team members when they are not able to perform as expected or the ensuing conflicts cannot be resolved. Conflict management skills are important in this regard. Proactive conflict management requires the project leader to continuously monitor stress levels in the team in an attempt to anticipate the likelihood of rising conflict. Monitoring resource utilization levels in the project schedule and staying connected to project team members are also critical activities that the project leader must perform. Lastly, many projects require people with different skills at different times. Project leaders should be actively monitoring when these skills will be required and ensuring people join/transition off the project at the appropriate times.
The availability and effectiveness of non-labour resources are also closely monitored. In some instances, faulty or ineffective equipment has to be replaced. If the scope of the project changes, new equipment and technology may be required, which, in turn, may lead to additional work in procurement management.
Monitoring and controlling is about integrating all the teams while assuring that work is being completed at a steady rate to keep the project on track. This phase is vital to the overall success of the project. Thus, requiring additional, highly-skilled resources, which is a key consideration during the planning phase.
Qualitative monitoring is also very important to the overall success of the project. Earned value management (EVM) is a key technique used in this type of monitoring and will be examined in further depth in Section 7.3.
7.3 Introduction to Earned Value Management (EVM)
Monitoring the Schedule and Budget During the Project
A project leader must regularly compare the amount of money spent with the budgeted amount and report this information to key stakeholders. In addition, project leaders must also compare the progress of the actual work completed with the estimated durations in the project schedule.
The value of EVM can be highlighted through a few scenarios.
Let us assume that a project leader of a medium complexity project is reviewing the schedule with their team and concludes that they are achieving the project’s milestones. The team feels they are on track as a result. Therefore, the project leader confirms the project is on track.
Is the project on track?
We cannot truly know upfront if a project is on track. It may appear that milestones are being achieved, but perhaps this is so because the external resources on the team are spending a considerable amount of time outside their regular business hours to achieve these milestones. This would only become evident if the project leader reviewed the invoices paid to date.
Now, let us assume that the same project leader is reviewing the budget with their team and concludes that the invoices received are for the expected amounts. The team feels they are on track as a result. Therefore, the project leader confirms the project is on track.
Is the project on track?
Again, we cannot truly know if the project is on track. It is possible that actual costs incurred are as expected, but perhaps the work is not being completed as planned. This would become evident if the project leader reviewed the schedule.
It is important to integrate our schedule and budget and this is the value of the EVM approach.
Reporting Budget Progress on John’s Move
John estimated that the move would cost about $1,500 and take about 16 days. However, eight days into the project, John has spent $300. John reports to his friends that the project is going well because he is halfway through the project while only having spent 20% ($300/$1,500) of his budget. John’s friend, Carlita, points out that his report is not sufficient because he did not compare the amount spent to the budgeted amount for all the activities that should be done by the eighth day.
A budget report must compare the amount spent with the amount that is expected to be spent by that point in the project. Basic measures, such as percentage of activities completed, percentage of budget spent, and percentage of material units consumed, are adequate for less complex projects, but more sophisticated techniques, such as EVM, are used for projects with higher complexity.
Let us assume John’s move was a medium complexity project, so John has decided that EVM was required to truly understand whether his project is on track.
| Description | Quantity | Total Item Cost (Planned Value) |
| Lunch | 3 | $45.00 |
| Small Boxes | 10 | $17.00 |
| Medium Boxes | 15 | $35.25 |
| Large Boxes | 7 | $21.00 |
| Extra Large Boxes | 7 | $26.25 |
| Short Hanger Boxes | 3 | $23.85 |
| Box Tape | 2 | $7.70 |
| Markers | 2 | $3.00 |
| Mattress/Spring Bags | 2 | $5.90 |
| Life Straps per Pair | 1 | $24.95 |
| Bubble Wrap | 1 | $19.95 |
| Furniture Pads | 4 | $31.80 |
| Total: $261.65 |
Table 7.4.1: Planned Value for Lunch and Packing Materials
If you sum the budgeted cost of work performed (BCWP) values up to a specified point in the project schedule, you have the earned value (EV). Due to the fact that projects occur in ever-changing environments, the amount spent on an item is often more or less than its estimated budgeted amount. The actual cost (AC) is the sum of the amounts actually spent on the items as opposed to their planned value (PV).
Comparing PV, EV, and AC in John’s Move on Day Six
John decided to offer to buy Dion and Carlita lunch. Although this was not part of his original plan, he believed it would be a nice gesture of gratitude. He estimated lunch would cost $45. As it turns out, Dion and Carlita only wanted a nice salad. Consequently, the lunch cost less than expected. John makes a stop at a store that sells moving supplies at discount rates. They do not have all the items he needs, but the prices are lower than those quoted by the moving company. They have a very good price on lifting straps, so he decides to buy an extra pair. He returns with some of the items on his list, but this phase of the job is not complete by the end of day six. John bought half of the small boxes, all of five other items, twice as many lifting straps, and none of four other items. John is only six days into his project, and his costs and performance are starting to vary from the plan. As demonstrated below, earned value analysis provides the project with a method for reporting variations in the progress. Note: quantity of each item is in brackets in the cost column.
| Planned Value | Earned Value | Actual Cost (AC) | |
| Description | Cost | Cost | Cost |
| Lunch | $45.00 (3) | $45.00 (3) | $35.00 (3) |
| Small Boxes | $17.00 (10) | $8.50 (5) | $9.50 (5) |
| Medium Boxes | $35.25 (15) | $35.25 (15) | $28.00 (15) |
| Large Boxes | $21.00 (7) | ||
| Extra-Large Boxes | $26.25 (7) | ||
| Short-Hanger Boxes | $23.85 (3) | ||
| Box Tape | $7.70 (2) | $7.70 (2) | $5.50 (2) |
| Markers | $3.00 (2) | $3.00 (2) | $2.00 (2) |
| Mattress/Spring Bags | $5.90 (2) | $5.90 (2) | $7.50 (2) |
| Life Straps per Pair | $24.95 (1) | $24.95 (1) | 38.50 (2) |
| Bubble Wrap | $19.95 (1) | ||
| Furniture Pads | $31.80 (4) | $31.80 (4) | 28.50 (4) |
| $261.65 | $162.10 | $154.50 |
Table 7.4.2: Planned Value, Earned Value, and Actual Cost
Note: a time-phased budget is often created to depict the project’s expenditures over time. The time-phased budget for John’s move could depict daily costs leading up to the completion of the move. The time-phased budget is created by combining the duration of the tasks with their cost. The cost of the task would be spread out over the duration of the task. However, for the purposes of this course, the table above is sufficient.
The original schedule called for spending $261.65 (PV) by day six. Based on the estimates, the value of work completed was $162.10 (EV), but the actual cost was only $154.50 (AC).
Using the above analysis, John can now determine how far off he is from his original plans. Let us examine how variances are determined in EVM.
Schedule Variance
The difference between planned and actual progress is the schedule variance. The schedule variance (SV) is the difference between the EV and the PV. It can be expressed as a formula:
SV = EV − PV
If less value has been earned than was planned, the schedule variance is negative, which means the project is behind schedule. Negative numbers indicate a negative situation whereas a positive variance indicates a positive situation (ahead of schedule).
The Schedule Variance on John’s Move
Planning for John’s move calls for spending $261.65 by day six, which is the PV. The difference between the PV and the EV is the SV.
Therefore, John’s SV = $162.10 – $261.65 = -$99.55
Since a negative schedule variance indicates the project is behind schedule, John’s move is behind schedule.
Cost Variance
The difference between EV and AC is the cost variance (CV). It can be expressed as a formula:
CV = EV – AC.
If the cost variance is a negative number, this indicates a negative situation or quite simply, the project is over budget. If the cost variance is a positive number, this indicates a positive situation and the project is under budget.
The Cost Variance on John’s Move:
The difference between the EV of $162.10 and the AC of $154.50 is the CV.
Therefore, John’s CV = $162.10 – $154.50 = $7.60
Since this is a positive number, John’s move is under budget.
When significant variances occur, this signals that corrective action is required from the project leader to bring the project back on track, and deliver it within the original schedule and budget. When presenting the results of EVM to key stakeholders, they are less interested in the numbers themselves and more interested in their meaning. Due to this, summarizing data succinctly is an important skill for the project leader. In addition, the project leader must be able to provide recommendations to get the project back on track.
The schedule variance provides the team with the amount of time that the project activities are behind (or ahead of) schedule while the cost variance provides the team with the amount that the project is exceeding (or not fully using) its budget. However, these variances do not provide the team with an idea of how the amounts compare to the total budget and total project duration. Let us examine the role of indexes in EVM.
Cost and Schedule Performance Indexes
Indexes measure efficiency. In the context of project budgets, the cost performance index (CPI) measures the cost efficiency of the work accomplished to date. The schedule performance index (SPI) measures the scheduling efficiency. Indexes are expressed as ratios.
The CPI uses the same variables as the CV but expresses them as a ratio. The ratio of EV to AC gives an indication of how much of the budget has been consumed.
CV = EV – AC
CPI = EV/AC
The SPI uses the same variables as the SV but also expresses them as a ratio. The ratio of EV to PV gives an indication of how much of the project is completed.
SV = EV – PV
SPI = EV/PV
Since indexes are a measure of efficiency, once the indexes have been calculated, we will be able to draw the following conclusions:
| Index | Cost Performance Index (CPI | Performance Index (SPI) |
| > 1.00 | Under budget | Ahead of schedule |
| 1.00 | On budget | On schedule |
| <1.00 | Over budget | Behind schedule |
The Cost Performance Index on John’s Move
In the John’s move example, at the end of day six, EV = $162.10 and AC = $154.50.
CPI = $162.10 ÷ $154.50 = 1.05. Since the value is greater than one, John is more efficient than planned and, as a result, the project is under budget. This is aligned with the conclusion from the CV which was $7.60 (recall that a positive number means a positive outcome and in this case, it means under budget). John is getting more value for his money than planned for the tasks scheduled by day six.
The Schedule Performance Index on John’s Move
At the end of day six, PV is $261.65.
SPI = EV/PV or $162.10 ÷ $261.65 = 0.62. Since it is less than one, this indicates the project is behind schedule. This also aligns with the conclusion from the SV which was -$99.55, (recall that a negative number signals a negative situation and in this case, it means behind schedule).
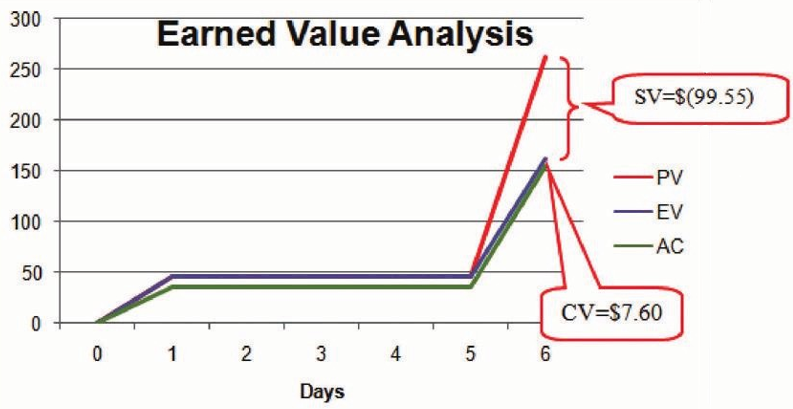
Exhibit 7.2: Graph representing that the variance between PV and EV is the SV while the variance between AC and EV is the CV.
Estimated Cost to Complete the Project
Partway through the project, the project leader evaluates the accuracy of the cost estimates for the completed activities and uses that experience to predict how much money will be required to complete the unfinished activities. This is called the estimate to complete (ETC).
To calculate the ETC, the project leader must decide whether the CVs observed in the estimates to date are representative of the future. For example, if unusually bad weather causes increased cost during the first part of the project, the same weather patterns may not be expected for the remainder of the project. If the project leader decides that the cost variance up to a certain point in the project is atypical (not typical), then the estimate to complete is the difference between the original budget for the entire project, known as budget at completion (BAC) and the EV up to that point. It can be expressed as a formula:
ETC = BAC − EV.
Estimate to Complete John’s Move
For his move, John was able to buy most of the items at a discount house that did not have a complete inventory, and he chose to buy an extra pair of lift straps. He knows that the planned values (PVs) for packing materials were obtained from the price list at the moving company where he will have to buy the rest of the items, so those two factors are not likely to be typical of the remaining purchases. The reduced cost of lunch is unrelated to the future costs of packing materials, truck rentals, and hotel fees. John decides that the factors that caused the variances are atypical.
In Section 5.5, John used the bottom-up method to estimate the total cost of the project at $661.25 (the BAC). The estimate to complete (ETC is the BAC minus the EV after 6 days.
Expressed as a formula:
ETC = BAC – EV
ETC = $661.25 − $162.10 = $499.15
If the project leader decides that the CV is caused by factors that will affect the remaining activities, such as higher labour and material costs, then the ETC must be adjusted by dividing it by the CPI.
In John’s move example, if we concluded the factors leading to the CV were typical, we would adjust the ETC by dividing it by the CPI, the formula is ETC = (BAC − EV) ÷ CPI.
Adjusted ETC for John’s Move
($661.25 – $162.10) ÷ 1.05 = $475.38Since we determined the project was trending under budget with a CPI of 1.05, if we expect the factors causing the project to be under budget to continue, we expect the adjusted ETC to be lower than the unadjusted ETC. In our John’s move example, the adjusted ETC is $23.77 lower ($499.15 – $475.38).
Estimating Final Project Cost
The estimate to complete (ETC) can be used to determine the new final project cost, which is the estimate at completion (EAC). This is done by adding the actual costs (AC) incurred to the ETC. It can be expressed as a formula: EAC = AC + ETC.
Estimate at Completion for John’s Move
The revised EAC for John’s move after 6 days is:
EAC = $154.50 + $499.15 = $653.65.
This is good news for John as his move will cost less than originally planned.
Estimating Final Project Completion Date
Let us assume John’s detailed planning work led to the conclusion that his move would take 15 days. After day six, he used EVM to determine that he is behind schedule. As noted above, the SPI is 0.62. If we assume that the lost time cannot be recovered, a simple way to predict the project’s new duration is to use the SPI as a measure of future schedule efficiency and apply it to the project’s original duration.
New time estimate = original time estimate (15 days) ÷ SPI (0.62) = 24 days
| Term | Description | Formula | John’s Move |
| Actual Cost (AC) | The money actually spent on projects up to the present. | – |
$154.50 |
| Budget at Completion (BAC) | Original budget for the entire project (same as the total BCWS) | – |
$661.25 |
| Planned Value (PV) | Sum of the estimates for work done up to the present | – |
$261.65 |
| Earned Value (EV)* | Sum of estimates for work actually done up to the present | – |
$162.10 |
| Cost Variance (CV) | Difference between earned value and actual cost | EV − AC | $7.60 |
| Cost Performance Index (CPI) | Ratio of earned value to actual cost | EV ÷ AC | 1.05 |
| Schedule Variance (SV) | Difference between earned value and planned value | EV − PV | -$99.55 |
| Schedule Performance Index (SPI) | Ratio of earned value to planned value | EV ÷ PV | 0.62 |
| Estimate to Complete (ETC) | Money to complete the project if early cost variance is atypical | (BAC − EV) ÷ CPI | $499.15 |
| Estimate at Completion (EAC) | Revised estimate of total project cost | AC + ETC | $653.65 |
Table 7.4.4: Summary of Terms and Formulas for Earned Value Analysis
—
* Earned Value is the % complete (for the task) multiplied by the total planned value (for the task)
To summarize the table above:
- Extra money is allocated in a contingency fund to deal with activities where costs exceed estimates. These overruns may have been identified while creating the risk management plan. Funds are allocated in a management reserve in case a significant, unanticipated opportunity or challenge occurs that requires change of scope, but funds are needed immediately before a scope change can typically be negotiated.
- Schedule variance (SV) is the difference between the part of the budget that has been spent at a specific point in time (EV) versus the part that was planned to be spent at that point in time (PV). Similarly, the cost variance is the difference between the EV and the actual cost (AC).
- The schedule performance index (SPI) is the ratio of the earned value and the planned value. The cost performance index (CPI) is the ratio of the earned value (EV) to the actual cost (AC).
- The formula used to calculate the amount of money needed to complete the project (ETC) depends on whether or not the cost variance to this point is expected to continue (typical) or not (atypical). If the cost variance is atypical, the ETC is simply the original total budget (BAC) minus the earned value (EV). If they are typical of future cost variances, the ETC is adjusted by dividing the difference between BAC and EV by the CPI.
- The final budget is the actual cost (AC) to this point plus the estimate to complete (ETC).
Corrective action on John’s Move:
EVM is a means to an end. The end is knowing which action needs to be taken as a result of the analysis performed. For example, John’s move is behind schedule and under budget. Before any action is taken, it is important to understand the priorities of the project. In this case, John would like to be in his new home in advance of beginning his new job. Therefore, he would prioritize the schedule over the budget if a trade-off was essential. Fortunately, in his current situation, since he is under budget, he could use some of the savings he has generated to make up for the schedule delays. His first step would be to revisit his future estimates and confirm whether he should anticipate any further delays and/or cost savings. Revising his estimates based on the new information he has received in the first six days of his move allows him to maintain realistic plans.
John has options. For instance, he may decide to use the existing savings he has generated and hire an assistant to help him buy the remaining items needed. The assistant would help him get things done much faster. Since he has not generated much savings, he may decide that it is worthwhile to spend more on his move than initially planned in order to achieve his timeline objective. In this case, he would be intentionally be planning to go over budget. Since he is only accountable to himself, gaining stakeholder approval would be easy. This is often not the case, so project leaders must use effective change management processes when similar situations occur.
In conclusion, earned value management gives project teams the ability to take corrective action before it is too late.
7.4 The Importance of Soft Skills in Keeping Projects on Track
Discenza and Forman’s research identified seven common issues that may cause project failure1:
- Lack of focus on business value
- Lack of accountability for clear, measurable results
- The wrong methodology was used
- The customer only engaged upfront
- Project leadership failed to engage and motivate the project team
- Team members lacked access to the tools, techniques and subject matter experts required
- Inconsistent project check-ins that lack qualitative and quantitative measures
The interpersonal skills of the project leader are critical to project success. Effective and timely communication is the underlying theme.
References
1 Discenza, R., & Forman, J. B. (2007). Seven causes of project failure: how to recognize them and how to initiate project recovery. Paper presented at PMI® Global Congress 2007—North America, Atlanta, GA. Project Management Institute.
