9. Appendix
9.1 Project management mathematics
Financial Calculations used in Project Selection
In many new project endeavours, determining if a project is financially feasible is an important first step. Three common financial calculations are used to do this: net present value (NPV), rate of return (ROI), and payback analysis.
NPV
A dollar earned today is worth more than a dollar earned one or more years from now. The NPV of a time series of cash flows considers both the incoming and outgoing streams of money. The incoming streams represent the benefits associated with the project. The outgoing streams represent the costs or investments made in the project. Each cash inflow/outflow is discounted back to its present value (PV) and then summed. Net present value is the sum of the discounted cash inflows minus the sum of the discounted cash outflows.
NPV is a standard method for using the time value of money to appraise long-term projects. The discount rate is the rate of return that money could earn elsewhere. As such, it is often referred to as the hurdle rate.
Expressed as a formula, it is as follows:
Rt
———-(1 + i)t
where:
- t is the time of the cash flow
- i is the discount rate (the rate of return that could be earned on an investment in the financial markets with similar risk; the opportunity cost of capital)
- Rt is the net cash flow (i.e., cash inflow − cash outflow, at time t)
NPV is an indicator of how much value an investment or project adds to an organization. With a particular project, if NPV is a positive value, the project is generating a positive cash inflow. If NPV is a negative value, the project investment exceeds the return. In financial theory, if there is a choice between two mutually exclusive alternatives, the one yielding the higher NPV should be selected.
| If… | It means… | Then… |
| NPV > 0 | The investment would add value to the firm. | The project may be accepted. |
| NPV < 0 | The investment would subtract value from the firm. | The project should be rejected. |
|
NPV = 0 |
The investment would neither gain nor lose value for the firm. |
We should be indifferent in the decision whether to accept or reject the project. This project adds no monetary value. The decision should be based on other criteria (e.g., mandatory requirements to complete the project, strategic positioning or other factors not explicitly included in the calculation). |
Table 9.1: Net present value
| Periods (years) | 6% | 8% | 10% | 12% | 14% |
| 1 | 0.943 | 0.926 | 0.909 | 0.893 | 0.877 |
| 2 | 0.890 | 0.857 | 0.826 | 0.797 | 0.769 |
| 3 | 0.840 | 0.794 | 0.751 | 0.712 | 0.675 |
| 4 | 0.792 | 0.735 | 0.683 | 0.636 | 0.592 |
| 5 | 0.747 | 0.681 | 0.621 | 0.567 | 0.519 |
| 6 | 0.705 | 0.630 | 0.564 | 0.507 | 0.456 |
| 7 | 0.665 | 0.583 | 0.513 | 0.452 | 0.400 |
| 8 | 0.627 | 0.540 | 0.467 | 0.404 | 0.351 |
| 9 | 0.592 | 0.500 | 0.424 | 0.361 | 0.308 |
| 10 | 0.558 | 0.463 | 0.386 | 0.322 | 0.270 |
(Take note of the decreasing value of money as the period increases from 1 to 10 years.)
Table 9.2: Net present value
NPV Example
The following example is calculating the NPV of a project at a discount rate of 12%. The project takes five years to complete with given benefits and costs for each year. In Year 0, there is no benefit to the organization, just an initial cost of $75,000 with no discount rate. In Year 1, the discount rate is 89%. This means that at 12% assumed interest, the time value of money says that the $1 today is worth $0.89 in one year, $0.80 in two years, etc. By calculating the NPV for the benefits and the costs, you subtract the NPV of all costs from the NPV of all benefits. The final result is a positive value of $105,175.
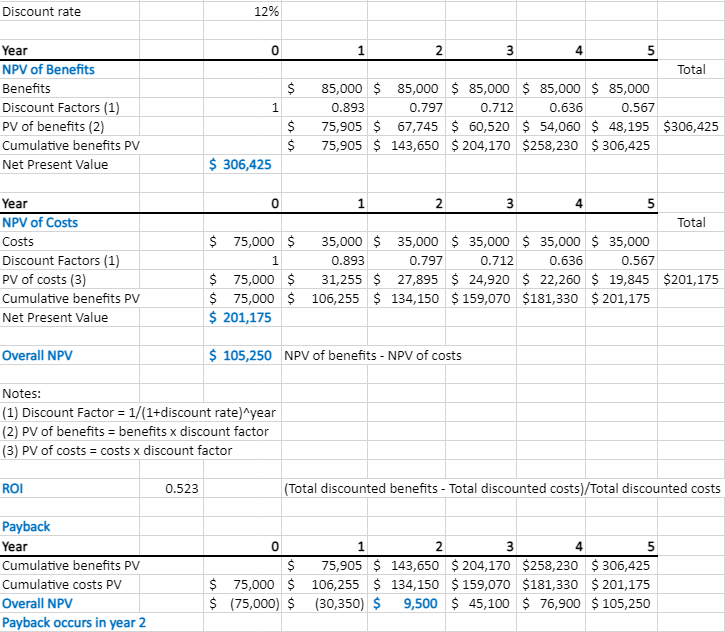
Table 9.3: Table of NPV of costs and benefits (PV factors come from Table 9.2) (accessible version)
Return on Investment
Return on investment (ROI) is a performance measure used to evaluate the efficiency of an investment or to compare the efficiency of a number of different investments. It is one way of considering profits in relation to capital invested.
This is calculated by subtracting the project’s costs from the benefits and then dividing by the costs. For example, if you invest $100 and your investment is worth $110 next year, the ROI is (110 − 100) ÷ 100 = 0.1 or a 10% return.
In our example above, the investment is $306,425 and the total costs are $201, 175. The ROI calculation would be ($306,425 − $201,175) ÷ 201,175 = 0.52, or a 52% return. That is considered a nice return on investment.
Payback Analysis
Payback analysis is important in determining the amount of time it will take for a project to recoup its investments. This is the point at which the benefits start to outweigh the costs. The best way to see that is by charting the cumulative benefits and costs. As you can see in the example in Exhibit 9.1, the cumulative benefits outweigh the cumulative costs in the second year.
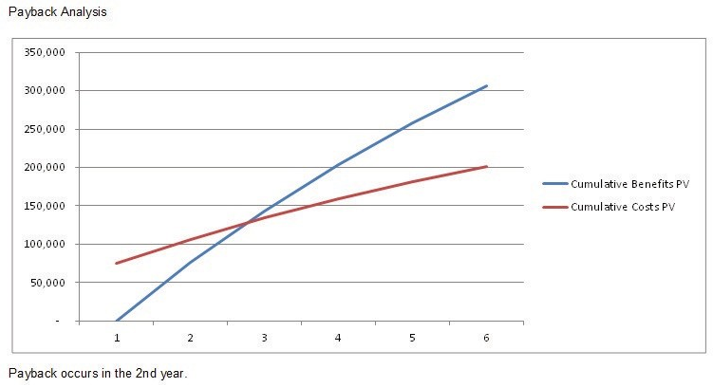
Exhibit 9.1: Payback analysis chart
