6 Managing Quality

Learning Objectives
- Understand dimensions of design quality, process quality and service quality.
- Describe the quality gurus that contributed to the modern field of quality.
- Discuss the costs of quality.
- Understand and Differentiate between TQM, ISO9001 and Six Sigma.
- Describe the tools used in quality improvement projects.
In today’s business environment, quality can be broadly defined as the extent to which a product or service meets or exceeds a customer’s expectations.
Prior to the 1980s, Quality was not a main priority for North American manufacturers. As high-quality goods began flowing into North American markets from Japan, it slowly became apparent that North American companies had fallen behind. Japanese products began to be preferred by consumers who recognized their superior level of quality. This was the case especially in the automotive market.
For any product the quality of that product is determined by two primary factors. These are DESIGN quality and PROCESS quality.
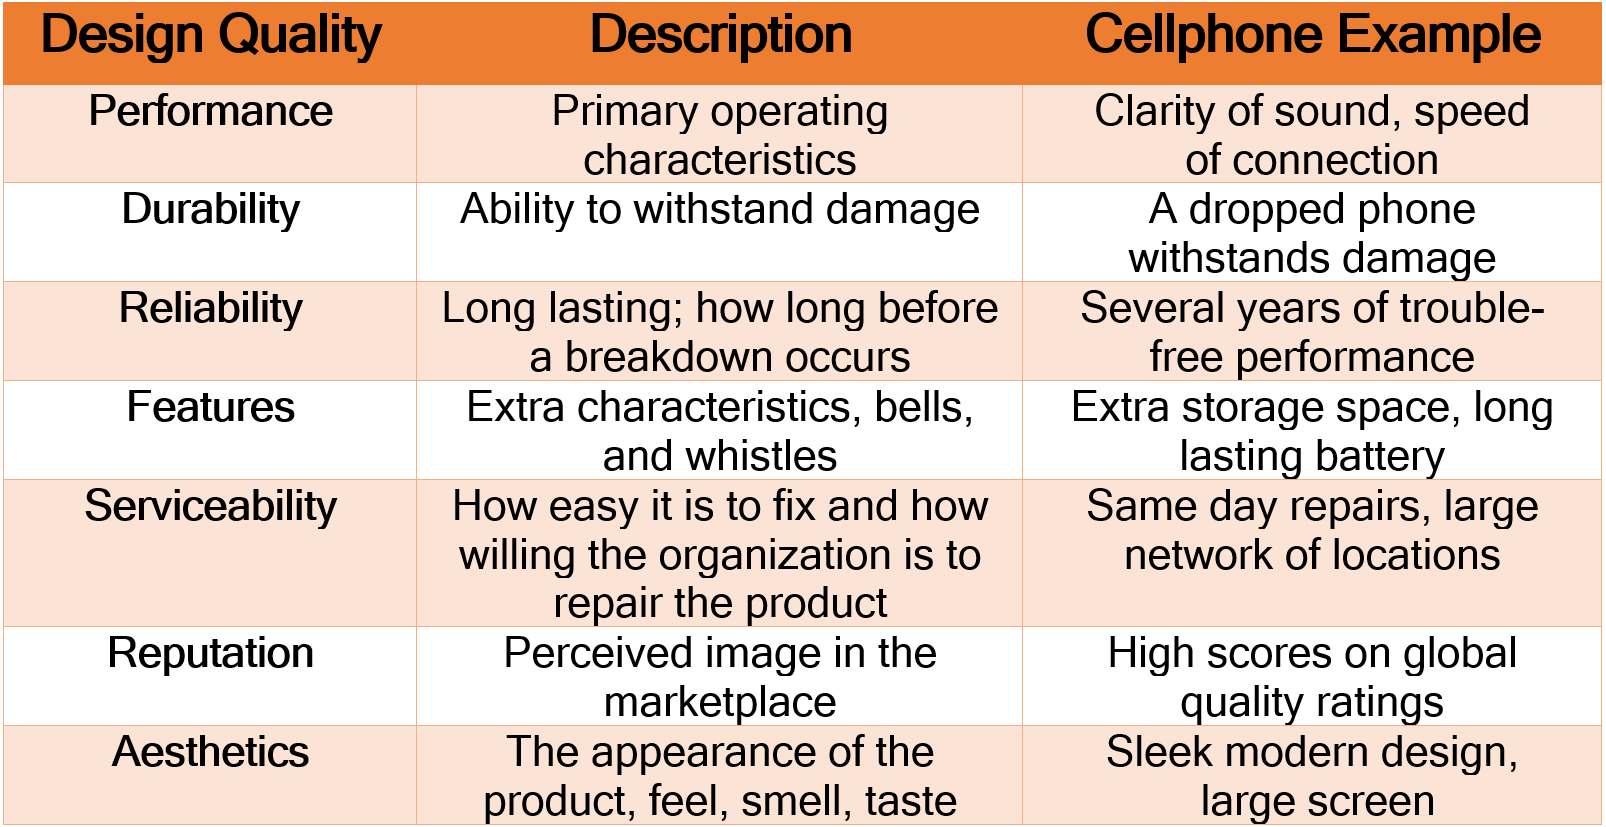
Design quality can be described as the quality that a product has in terms of the actual characteristics of the product. Think about the design of your favourite cell phone. The decisions made by Marketing as well as the Design team will determine the way your phone will operate, the quality of the sound, the features it has, not to mention the way it looks, feels and lasts. Below are some facets of quality in products.[1]
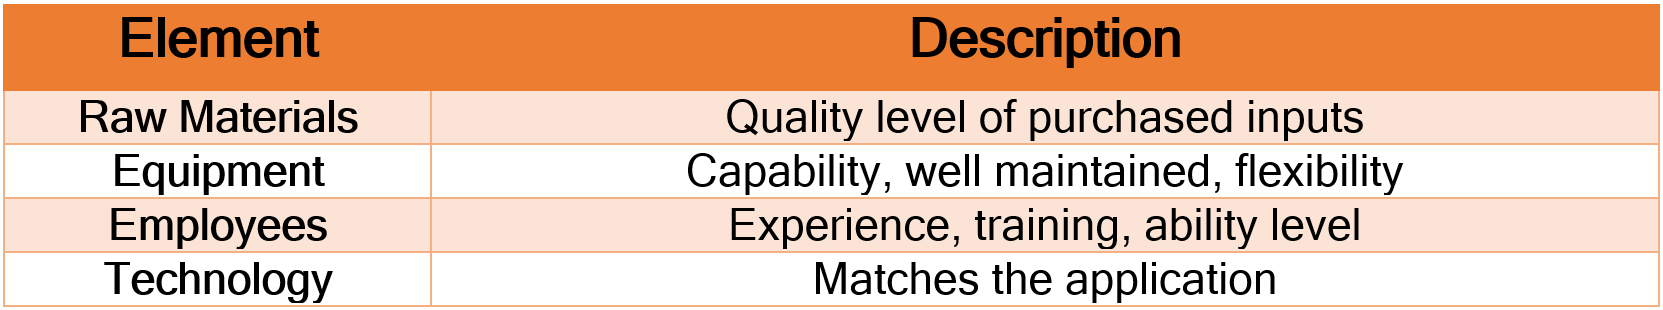
Process quality refers to the ability of the organization to produce the good or service having perfect quality at each stage of the process, or in other words, manufacturing defect-free products.
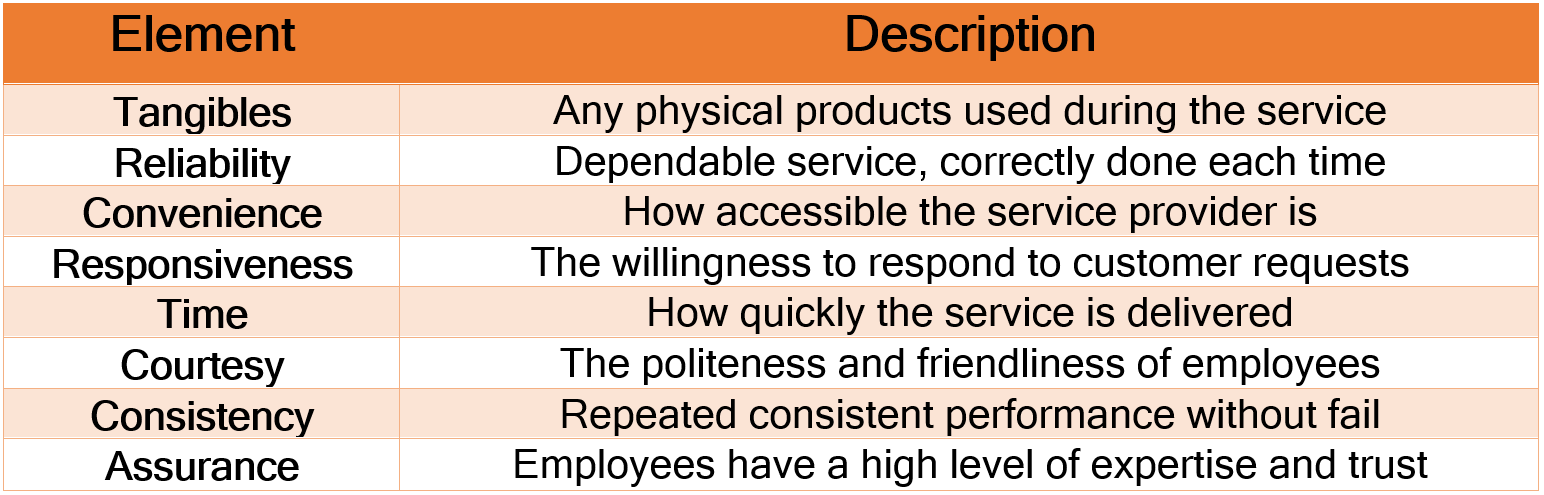
Measurement of service quality is more challenging. Each customer has a certain performance level in mind from which to compare or evaluate a service. Below are some of the commonly accepted elements in which customers evaluate service performance.
Accessible format for Figures 5.1-5.3
Gurus of Quality
Much of the field of Quality originated from several individuals who spent their careers researching, teaching and developing the field of Quality. These individuals are Walter Shewhart, W. Edwards Deming, Joseph Juran, Philip Crosby and Armand Fiegenbaum.
Walter Shewhart (1891-1967)
Dr. Shewhart was an American physicist, engineer and statistician. He is known as the father of statistical quality control and spent much of his career researching variation and is credited with the creation of the first control chart. His work focused around the need to reduce variation in order to improve quality. He is responsible for the concepts of assignable and common variation.
The processes that produce goods and services will all have some variation. It is intuitive that the more variation in processes, the poorer the quality will be. Assignable variation is the type of variation where the cause can be clearly identified and corrected or managed. An example of an assignable variation might be an error by an employee, a software glitch, or a tool breakage. Common variation, also referred to as chance variation, is the type of variation that is inherent in the process. It is generally to be expected, and not a cause of an error. Intuitively, if we reduce or minimize either variation, we will improve product quality.
Edwards Deming (1900-1993)
Dr. Deming is likely the most well known of the Quality Gurus. He was an American engineer, statistician, professor and author. Dr. Deming was recruited to Japan after WWII to assist with their national census. Beginning in 1950 Deming trained thousands of Japanese engineers, managers, and scholars in basic statistical process control. He is credited with guiding the rise of Japanese superior quality. In appreciation for Deming’s guidance the Japanese named their highest quality award after Dr. Deming (The Deming Prize). Dr. Deming has an extensive list of published works but is likely most well known for Deming’s 14 points[2] and the Deming Cycle.
Edwards Deming’s “14 points:”
- Create constancy of purpose toward improvement of product and service, with the aim to become competitive, to stay in business and to provide jobs.
- Adopt the new philosophy. We are in a new economic age. Western management must awaken to the challenge, must learn their responsibilities, and take on leadership for change.
- Cease dependence on inspection to achieve quality. Eliminate the need for massive inspection by building quality into the product in the first place.
- End the practice of awarding business on the basis of a price tag. Instead, minimize total cost. Move towards a single supplier for any one item, on a long-term relationship of loyalty and trust.
- Improve constantly and forever the system of production and service, to improve quality and productivity, and thus constantly decrease costs.
- Institute training on the job.
- Institute leadership The aim of supervision should be to help people and machines and gadgets do a better job. Supervision of management is in need of overhaul, as well as supervision of production workers.
- Drive out fear, so that everyone may work effectively for the company.
- Break down barriers between departments. People in research, design, sales, and production must work as a team, to foresee problems of production and usage that may be encountered with the product or service.
- Eliminate slogans, exhortations, and targets for the work force asking for zero defects and new levels of productivity. Such exhortations only create adversarial relationships, as the bulk of the causes of low quality and low productivity belong to the system and thus lie beyond the power of the work force.
- Eliminate work standards (quotas) on the factory floor. Substitute with leadership.
- Eliminate management by objective. Eliminate management by numbers and numerical goals. Instead substitute with leadership.
- Remove barriers that rob the hourly worker of his right to pride of workmanship. The responsibility of supervisors must be changed from sheer numbers to quality.
- Remove barriers that rob people in management and in engineering of their right to pride of workmanship.
- Institute a vigorous program of education and self-improvement.
- Put everybody in the company to work to accomplish the transformation. The transformation is everybody’s job.
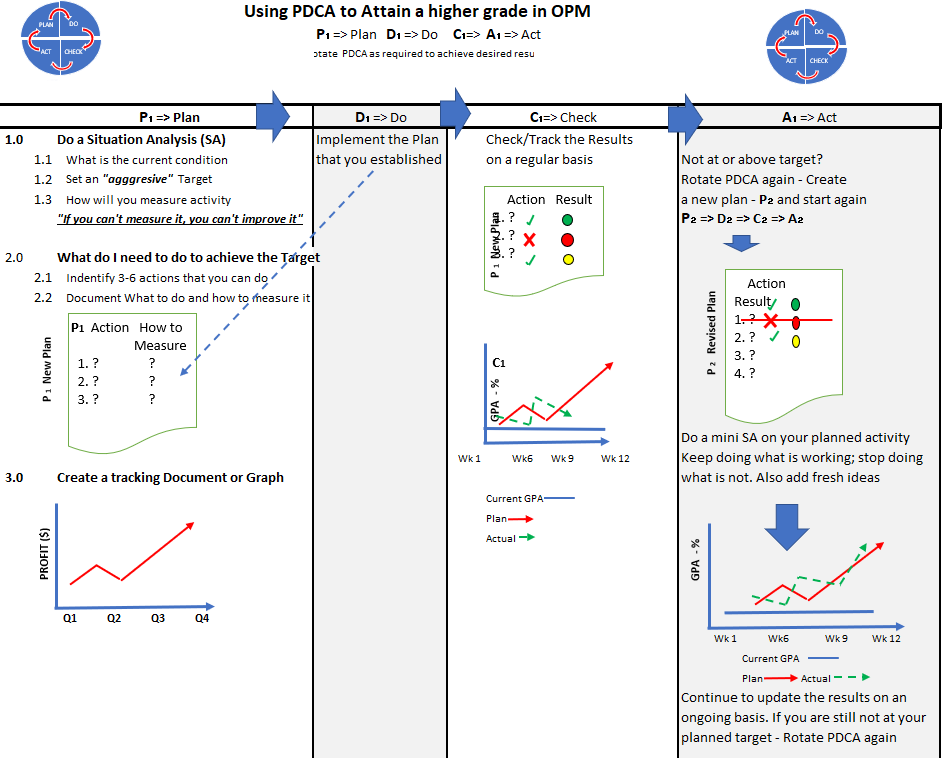
The Deming Cycle or Deming Wheel is also known as PDCA, or “Plan, Do Check, Act.” It is a version of continuous improvement that emphasizes the continuous nature of process improvement.
Accessible format for Figure 5.4
Joseph Juran (1904-2008)
Juran was a Romanian-born American engineer. He is best known for the Quality Control Handbook, which was first published in 1951. He emphasized the importance of three specific factors which came to be known as the quality trilogy: quality planning, quality control and quality improvement. He authored hundreds of papers and 12 books. He is responsible for creating the concept known today the cost of quality. The Juran Institute in the U.S. is a leader in training and research in quality. Joseph Juran also came upon the work of Vilfredo Pareto (1848-1923) and made the Pareto Principle, also known as the 80/20 rule, well known today as a tool for problem solving and continuous improvement.
Pareto was an Italian economist and sociologist who noticed that 80% of the land in Italy was owned by about 20% of the population. This Pareto principle is alive and well today in the field of quality and continuous improvement. It is generally accepted that 80% of defects can be traced to a small number (20%) of the causes. Firms need to ensure that they are concentrating on fixing the correct or “root” causes.
Other examples of the 80/20 rule
- 80% of a company’s profits are generated by 20% of the products or services sold
- 80% of the continuous improvement ideas are generated by 20% of the employees
Philip Crosby (1926-2001)
Crosby was an American businessman and author. He published Quality is Free in 1979. He believed that the costs of quality are often understated. He coined the phrase zero defects and felt that there was no reason for any errors. He taught that it is less expensive to do it right the first time rather than to pay for extra inspection, scrap, rework and repairs.
Armand Fiegenbaum (1920-2014)
Dr. Feigenbaum was an American quality engineer and businessman. He was the Director of Manufacturing Operations at General Electric from 1958-1968. He devised the concept of total quality control, which later became total quality management (TQM). He is also known for his concept of a “hidden plant.” He felt that a large portion of a plant’s capacity is wasted due to the large amount of failures and defects.
Cost of Quality
Companies who provide excellent quality goods and services are obviously able to excel and differentiate themselves from competitors. They also tend to be more profitable and their losses and extra costs due to poor productivity, rework, inspection, and scrap will be negligible.
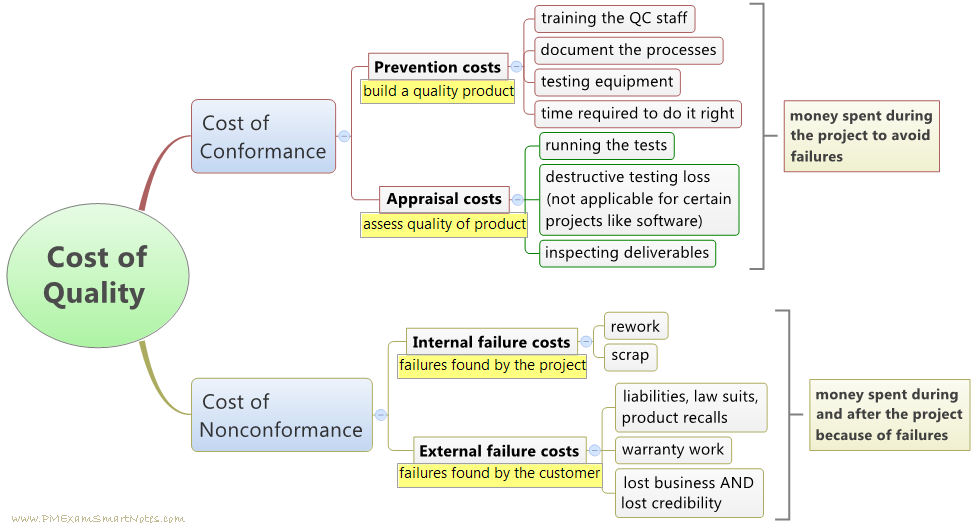
The various costs of quality can be broken down into the following four categories: prevention costs, appraisal costs, and failure costs, which are further classified as internal failure costs and external failure costs.
Prevention costs
Prevention costs include all the funds spent to prevent the occurrence of defects. Examples include quality improvement initiatives, employee training, upgrading of equipment, implementing quality procedures and making proactive design changes.
Appraisal costs
All money spent in checking and testing of product during the production process would be considered Appraisal costs. Wages of inspectors when defined as part of the process, testing labs and equipment, gauging, and process control, would be included in this category.
Internal failure costs
Once a defect has been produced, with any luck the organization will detect the error before it leaves the building and is sent to the customer. Often, defective products can be repaired, but all of the extra time spent on the rework is considered internal failure costs. Product that is unable to be repaired is classified as scrap. This also is Internal Failure costs. This can cause many other problems because customers still expect on-time deliveries. Often other orders may have to be re-manufactured and expedited in order to compensate for products that are scrap. The customer is often not aware of these issues.
External failure costs
Once a defective product has been shipped to the customer, the costs then become external failure costs. Replacement product, expedited shipping, potential law suits, product recalls, and of course loss of future business are all external failure costs. It is impossible to predict the actual external failure costs since there is no way of gauging the impact of dissatisfied customers on future business.
Quality Systems
Three common quality systems that many organizations use in order to manage their quality are total quality management (TQM), ISO9001, and Six Sigma.
Total Quality Management (TQM)
To compete today, companies must deliver quality goods and services that satisfy customers’ needs. This is the objective of quality management. Total quality management (TQM), or quality assurance, includes all the steps that a company takes to ensure that its goods or services meet or exceed the customers defined specifications and are of sufficiently high quality to meet customers’ needs. Generally speaking, a company adheres to TQM principles by focusing on three tasks:
- Customer satisfaction
- Employee involvement
- Continuous improvement
Let’s take a closer look at these three principles.[3]
Customer Satisfaction
Companies that are committed to TQM understand that the purpose of a business is to generate a profit by satisfying customer needs. Thus, they let their customers define quality by identifying and offering those product features that satisfy customer needs. They encourage customers to tell them how to make the right products, both goods and services, that work the right way.
Armed with this knowledge, they take steps to make sure that providing quality is a factor in every facet of their operations—from design, to product planning and control, to sales and service. To get feedback on how well they’re doing, many companies routinely use surveys and other methods to monitor customer satisfaction. By tracking the results of feedback over time, they can see where they need to improve.
Employee Involvement
Successful TQM requires that everyone in the organization, not simply upper-level management, commits to satisfying the customer. When customers wait too long at a drive-through window, it’s the responsibility of a number of employees, not the manager alone. A defective DVD isn’t solely the responsibility of the manufacturer’s quality control department; it’s the responsibility of every employee involved in its design, production, and even shipping. To get everyone involved in the drive for quality assurance, managers must communicate the importance of quality to subordinates and motivate them to focus on customer satisfaction. Employees have to be properly trained not only to do their jobs but also to detect and correct quality problems.
In many companies, employees who perform similar jobs work as teams, sometimes called quality circles, to identify quality, efficiency, and other work-related problems, to propose solutions, and to work with management in implementing their recommendations.
Continuous Improvement
An integral part of TQM is continuous improvement: the commitment to making constant improvements in the design, production, and delivery of goods and services. Improvements can almost always be made to increase efficiency, reduce costs, and improve customer service and satisfaction. Everyone in the organization is constantly on the lookout for ways to do things better.
ISO
The International Organization for Standardization (ISO) is an international standard-setting body composed of representatives from various standards organizations.
Founded on 23 February 1947, the organization promotes worldwide proprietary, industrial and commercial standards. It is headquartered in Geneva, Switzerland, and works in 164 countries.
ISO is an independent, non- governmental organization and is the largest developer of voluntary international standards. Use of these standards assists organization to create products and services that are safe, reliable and of good quality. The standards help businesses increase productivity while minimizing errors and waste. By enabling products from different markets to be directly compared, they facilitate companies in entering new markets and assist in the development of global trade on a fair basis. The standards also serve to safeguard consumers and the end-users of products and services, ensuring that certified products conform to the minimum standards set internationally.[4]
Video: What ISO Standards do for you
Steps in obtaining ISO certification
- A firm must initially begin by documenting and implementing their systems for quality management. Add: These documents must include Policy, Procedures and work instructions. This is no small task. This documentation may take a great deal of time, effort and collaboration by all of their employees. In addition to this, the company will develop a Quality Manual that outlines how they will assure the quality of their goods and service.
- Training of all employees involved with these processes must take place. The employees must gain full understanding and be comfortable with these new work procedures and documents
- An audit must take place. The organization must arrange to have a certification body come to complete the audit. There are many different private companies that have been granted (by ISO) the authority to grant ISO9000 certification. These private companies are themselves accredited by ISO.
The cost for the above steps will clearly depend largely on the size and complexity of the organization. Many firms choose to use external consultants to guide and assist them in this process. Generally it is accepted that it will take somewhere from 12 to 18 months to complete this process. The usual certification process lasts for three years. Skeptics think that some organizations pursue their ISO Certification only because customers require it. In reality, a deep desire to improve internal performance should be the intrinsic motivation to implement any quality program.
What benefits are there to obtaining ISO certification?
The benefits of ISO certification are many. Read the article below from Business Development Bank of Canada.
Short Article: Seven ways ISO certification can help your business
There are other certifications besides ISO9001. ISO14001 is an International Standard for evaluating a firm’s environmental performance.
Hazard Analysis Critical Control Point (HACCP)
HACCP is a quality management system for organizations in the food processing industry. By implementing a HACCP program, the following results will be obtained:[5]
- gain customer confidence
- sharpen your competitive edge and develop new export opportunities
- achieve more rigorous quality control
- reduce waste and spoilage
- control contamination risks and recall processes
- build awareness of hygiene and safety for employees
- eliminate potential allergen issues
What are the seven principles of HACCP?
Think of HACCP principles as the steps you need to take to manage and control food safety risks in your business.
The seven principles of HACCP are:[6]
- Conduct a Hazard Analysis
- Identify Critical Control Points
- Establish Critical Limits
- Monitor Critical Control Points
- Establish Corrective Actions
- Establish Record Keeping Procedures
- Establish Verification Procedures
Any food business must have the safety of their customers as they key priority. By implementing a successful HACCP program, these risks can be controlled to protect from the chances of a foodborne illness outbreak. In 2005 it became mandatory for federally registered meat and poultry establishments to become HACCP Certified. The Canadian Food Inspection agency recommends HACCP compliance certification for all food businesses in the food supply Chain.
Video: Alberta Agriculture and Forestry on HACCP
Six Sigma
You may end up accepting a job in an organization that has a Six Sigma Program. Six Sigma is a set of techniques and tools for process improvement. It was introduced by engineer Bill Smith while working at Motorola in 1980. It is a comprehensive quality system for achieving business success by minimizing variation in business processes. The term Six Sigma quality is used to describe a process in which a process is so well controlled, that there is no more that 3.4 defects per million opportunities.
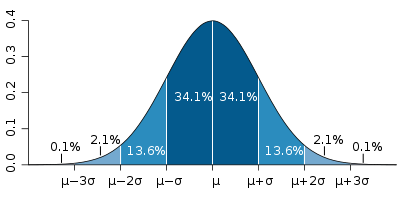
Six Sigma comes from the term in statistics of sigma, meaning standard deviation. It is a measure of the amount of variation in a set of data. A usual company process might operate at a 3 sigma quality level. This indicates that 99.73% of all output will fall between plus and minus three standard deviations of the mean. The result then would be that 0.27% of all results are non-conforming, or defective. This is equivalent to 2700 defects per million opportunities. This is not so good if the business is operating in an industry where quality is critical to customer safety, such as manufacturing of aircraft, cars or medical devices. A process with a Six Sigma capability generates 99.99966% defect free outputs.
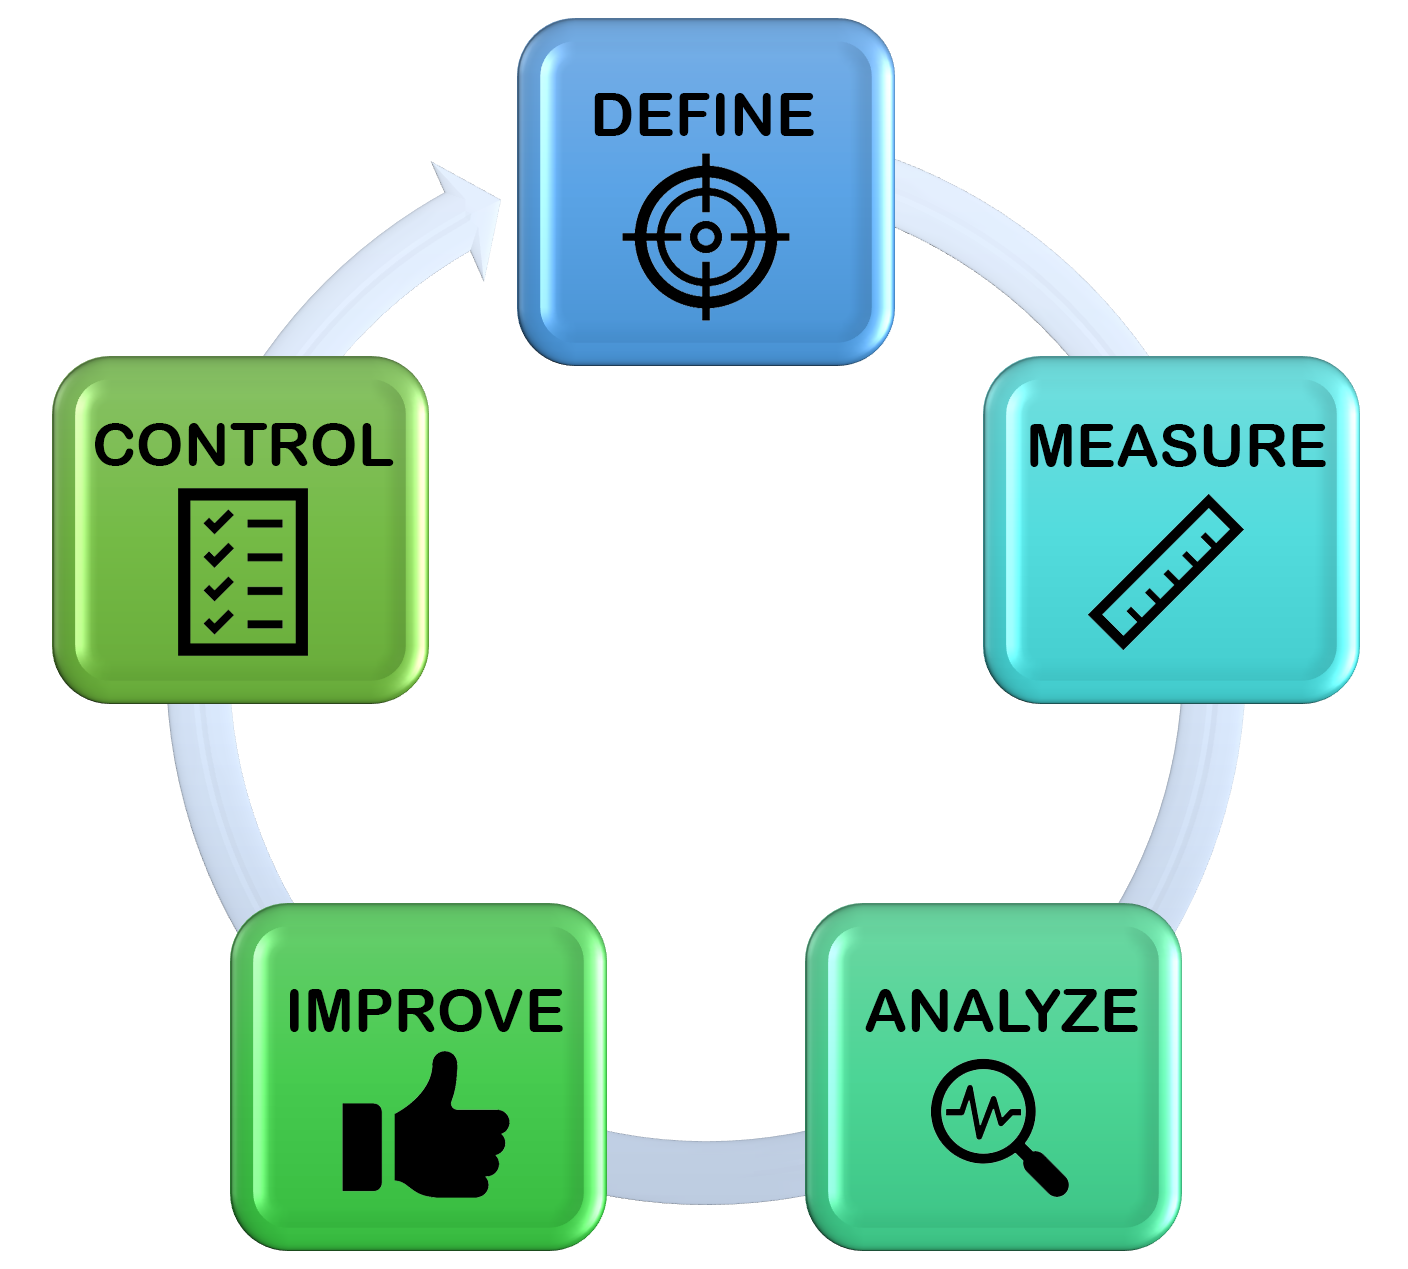
Unique to Six Sigma is the DMAIC Improvement Model. In Six Sigma, improvements are made by the use of project teams. A team may be assembled in order to fix a quality issue, to streamline an old process or to develop a new process. The team will use the DMAIC model, which is an acronym that stands for Define, Measure, Analyze Improve and Control. An explanation of the steps in the DMAIC process and some of the tools used are below.[7]
- Define the problem, beginning with who is the customer, what their needs are, and what is most important to the customer. What project is most suitable in order to improve and meet customer requirements?
- Measure process performance. Collect data of the current performance and compare to the desired state. Use a Pareto chart to analyze the frequency of problems or causes.
- Analyze the process to determine why defects are occurring and what are the causes of variation and poor performance (defects). Perform root cause analysis.
- Improve process performance by determining how to remove the causes of defects. Once the process is modified, results are measured to determine if the problem has been corrected.
- Control the improved process by implementing a plan to ensure that the improved process is maintained.
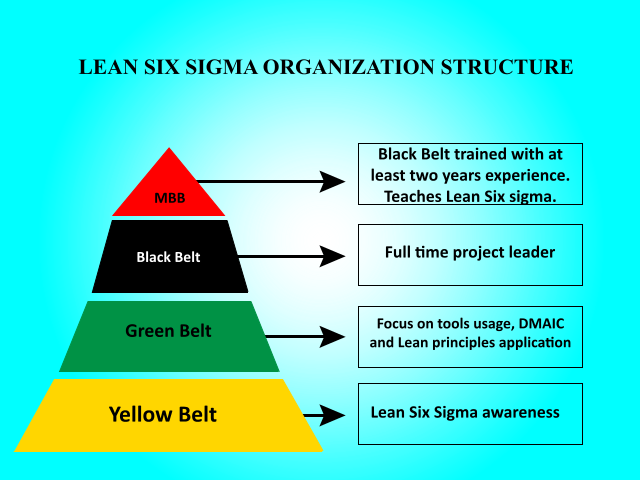
Also unique to Six Sigma is the use of the martial arts method of using coloured belts in order to symbolize the level of expertise in Six Sigma.
Green Belt is a designation indicating that an individual has had Six Sigma training. An individual with Green Belt status may have a full-time job in the organization but will be called upon to assist with projects part-time assisting with Six Sigma projects.
Black Belt is a full-time position in the Quality area where the individual works full time as a coach / leader in Quality projects. These individuals will have extensive experience in Six Sigma. They will spend the majority of their time leading project teams.
Master Black Belt is a full-time position in the Six Sigma team with extensive experience in managing projects. They coach and mentor the Black Belt leaders.
Champion is usually a senior manager in the organization who oversees the other Six Sigma Quality employees. The work on determining which projects should be prioritized, ensuring proper allocation of resources and removing any roadblocks that may prevent success.
Tools for Quality Improvement:
In any Quality improvement initiative, the collection and evaluation of data is a critical step. There are a number of basic generic tools that are most commonly used. These tools include check sheets, histograms, control charts, Pareto charts, scatter diagrams, as well as cause and effect diagrams.
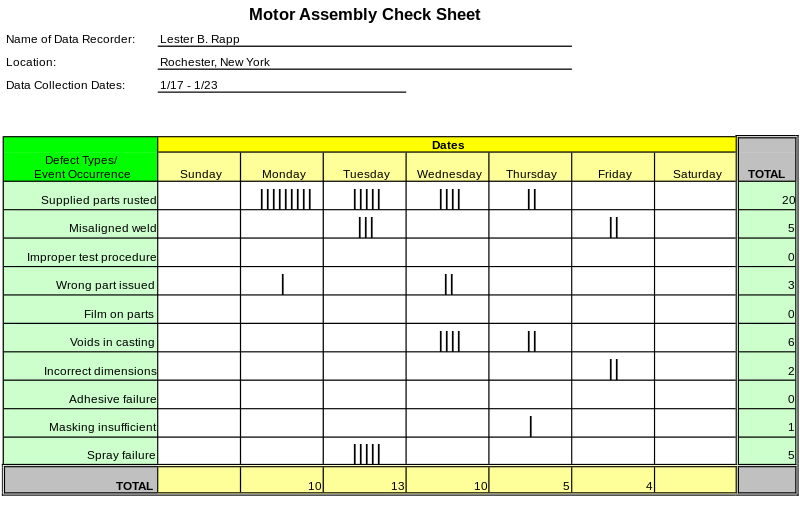
Check Sheets
This is a custom designed form used to record the number of occurrences of a particular outcome of interest. It may collect basic information such as how many incidents occurred, the timing, or the measurement that was non-conforming.
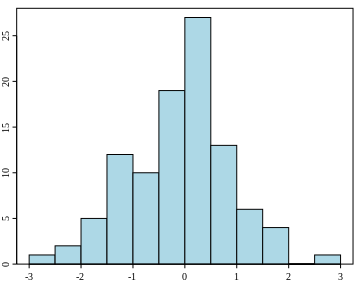
Histograms
Raw data from a check sheet may be put into a histogram. Data that is continuous in nature can be put into a Histogram that contains ranges of the data. It will show an accurate representation of the distribution of the data.
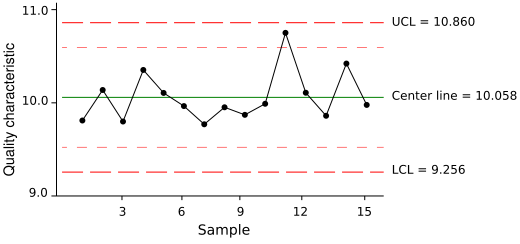
Control Charts
In order to monitor the performance of a process over time, a control chart is the appropriate tool. A Control Chart includes an Upper Control limit and a lower Control limit, which are used to control the quality dimension that is measured. As long as points seem to appear randomly on both sides of the mean and they fall between the upper and lower control limits, the process is assumed to be in control.
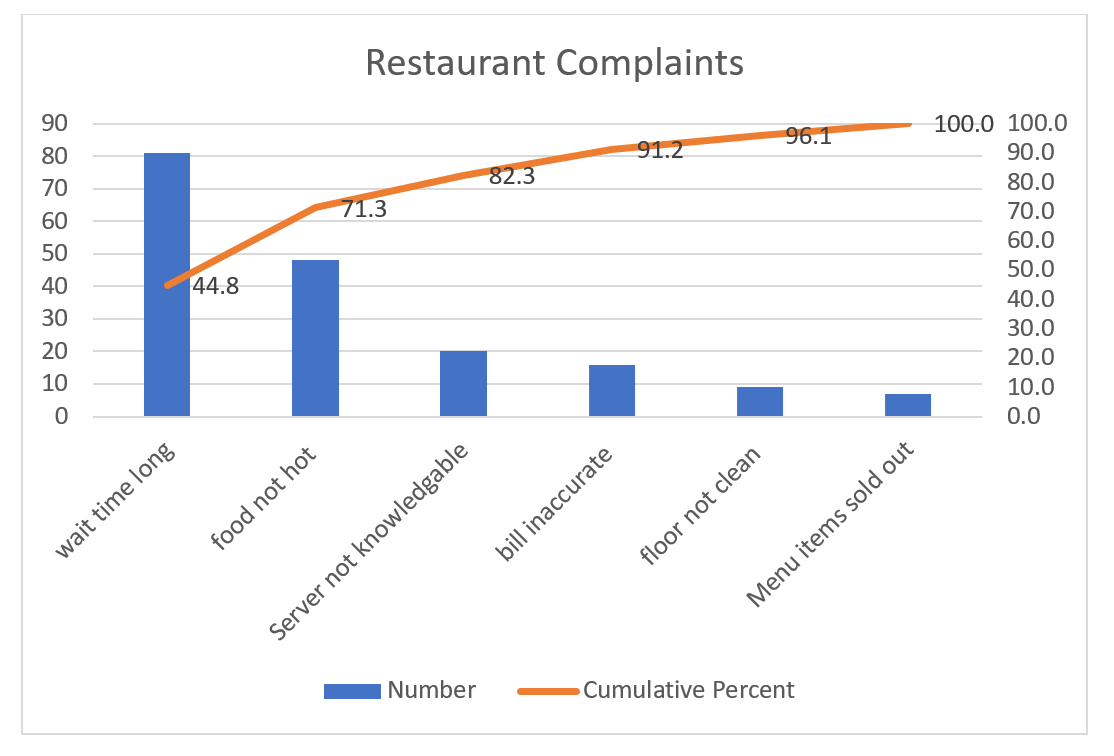
Pareto Charts
A special type of bar chart that shows the number of occurrences of a particular characteristic, ordered from highest to lowest. The X axis represents each characteristic and the Y axis is the number of times this occurrence was recorded. In addition, a cumulative percent line shows the cumulative percentage that each category represents. The Y axis on the right hand side of the chart corresponds to the percentage on this line. In the management of quality, managers must allocate resources to rectify the most frequently occurring problems. A Pareto analysis helps us focus our attention on the defects that occur the most frequently and to allocate the resources accordingly.
Video: How to make a Pareto chart in Excel
Steps in a Pareto Analysis:
- Collect your raw data and put it into a simple table in descending order. Sum the total number of results at the bottom of the column.
| Complaints | Number |
| Long wait time | 81 |
| food not hot | 48 |
| Server unknowledgeable | 20 |
| bill inaccurate | 16 |
| floor not clean | 9 |
| Menu items sold out | 7 |
- Include a cumulative column and calculate the cumulative percentage of each.
| Complaints | Number | Cumulative | Cumulative Percent |
| wait time long | 81 | 81 | 44.8 |
| food not hot | 48 | 129 | 71.3 |
| Server unknowledgeable | 20 | 149 | 82.3 |
| bill inaccurate | 16 | 165 | 91.2 |
| floor not clean | 9 | 174 | 96.1 |
| Menu items sold out | 7 | 181 | 100.0 |
- In EXCEL, your Pareto analysis will look like this.
Scatter Diagrams
A simple diagram helps to figure out if there is a relationship between two variables.

Cause and Effect Diagrams
Also known as a Fishbone diagram, it was developed by Dr. Ishikawa[8] to help identify the causes of a problem. The overall shape is that of a fish. The pointy end points to the ‘effect’ or the problem. Each of the ribs represents a major cause, or category that is a potential contributor to the problem. Commonly, the rib bones tend to be categories such as the man, method, material, machine, and environment. The actual factors that fall under each category are written on their related rib.

- Garvin, D. (1987). Competing on the Eight Dimensions of Quality. Retrieved on November 7, 2019, from https://hbr.org/1987/11/competing-on-the-eight-dimensions-of-quality%20accessed%20Dec%202019 ↵
- Wikipedia contributors. (2019). W. Edwards Deming. In Wikipedia, The Free Encyclopedia. Retrieved on November 9, 2019, from https://en.wikipedia.org/wiki/W._Edwards_Deming#Key_principles ↵
- Saylor Academy. (2012). Producing for Quality. Retrieved on November 9, 2019, from https://saylordotorg.github.io/text_exploring-business-v2.0/s15-07-producing-for-quality.html ↵
- Wikipedia contributors. (2019). International Organization for Standardization. In Wikipedia, The Free Encyclopedia. Retrieved on January 2, 2020, from https://en.wikipedia.org/w/index.php?title=International_Organization_for_Standardization&oldid=930771418 ↵
- https://www.bdc.ca/en/consulting/pages/haccp-certification.aspx ↵
- https://www.foodsafety.ca/blog/7-steps-food-safety-success-everything-you-need-know-about-haccp ↵
- https://asq.org/quality-resources/dmaic ↵
- https://en.wikiquote.org/wiki/Kaoru_Ishikawa ↵
